
App performance metrics are the key to success. Here is a great guide for mobile app analytics fundamentals.
Most app developers face a challenge in measuring app success. Thousands of apps release every day and most are not correctly tracked, unfortunately. Here, their failure becomes indispensable. App developers must be sure whether campaigns targeted the right audience and track their behaviors from the beginning to the end. Let’s look at some mobile app performance metrics to be sure your app will succeed.
First, a performance metric is a parameter that provides information about your users’ actions and experiences with your product. You can decide to continue with your strategy or regulate and improve it. It will directly affect your app’s long-term success. You can find the main mobile application performance metrics below.
Acquisition
Acquisition refers to the number of users who download and install your app, through organic search, WOM, or paid campaigns. You can track how much money you are spending to acquire these users and what they are doing in your app with this metric. This metric shows you the most efficient way to reach your potential audience because you have useful information about channels that your user traffic comes from with the acquisition metric. You can also test all viable channels often during your paid campaign for your app and measure this metric more effectively.
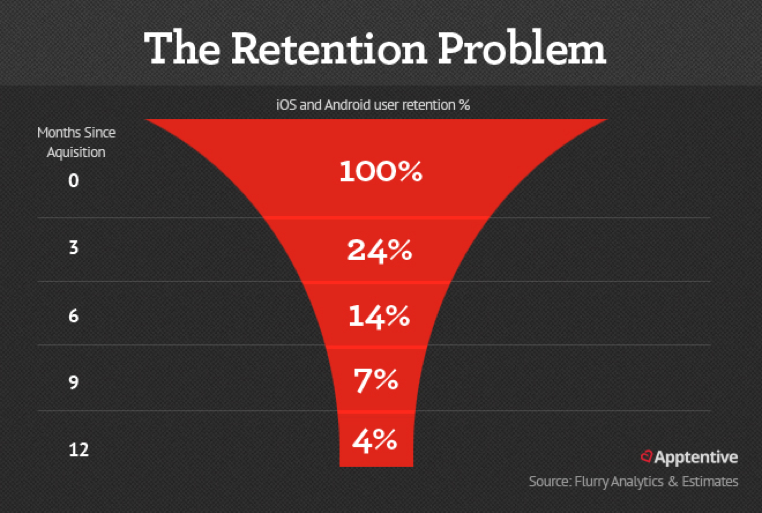
Retention
Retention rate indicates the percentage of users who visit your app after the initial download. It is especially important to see the flaws in your marketing efforts and determine your app’s viability in the market. You can track retention rate by using analytic tools and calculate it by several methods. The most common and easy method is by looking at the number of users returning to your app on an indicated day and dividing it by the number of users who installed your app on Day 0.
Engagement
Do you wonder whether your users are interacting with your app? Or how you can say your users are active? Generally, its definition is not standard. It is changeable from marketer to marketer, and it can be defined within the context of the individual app related to its marketing strategy. However, to be truthful, the definition might be a user who has opened the app 5 times or more in the simplest term. Users’ actions, like spending in-app, are also indicators of engagement. You can maintain or improve the satisfaction of your users and increase their willingness to continue to use, thanks to determining how active users use your app.
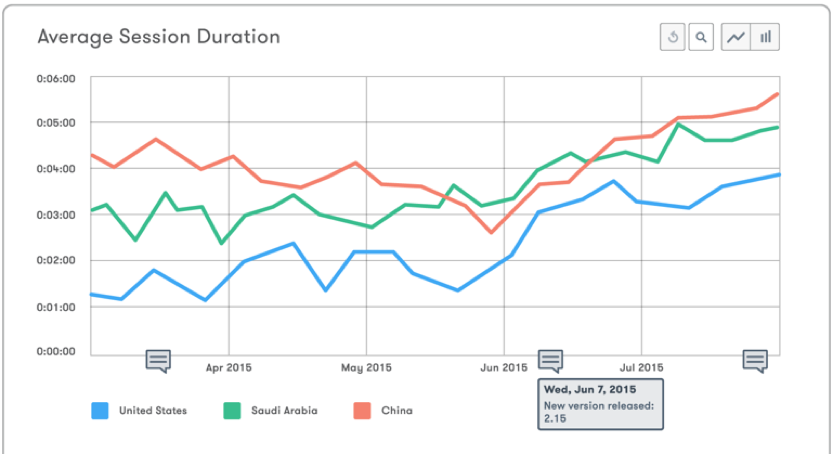
Session Length & Intervals
Session length and intervals are used to measure user’s behavior in your app. The first one, session length, indicates the time of a session in a single entering. If you want to know how often a user opens your app, you can track the interval metric, which indicates the time between sessions. They are important metrics to recognize how valuable your app is to a user and the users’ interest level in your app.
Customer Acquisition Cost (CAC)
Customer acquisition cost (CAC) means the price you pay to acquire a new customer. To see where the users came from into your app and how they behave, once they use your app, you can use the Customer Acquisition Cost (CAC) metric. Thanks to this metric, you can also understand whether your marketing campaign is profitable.

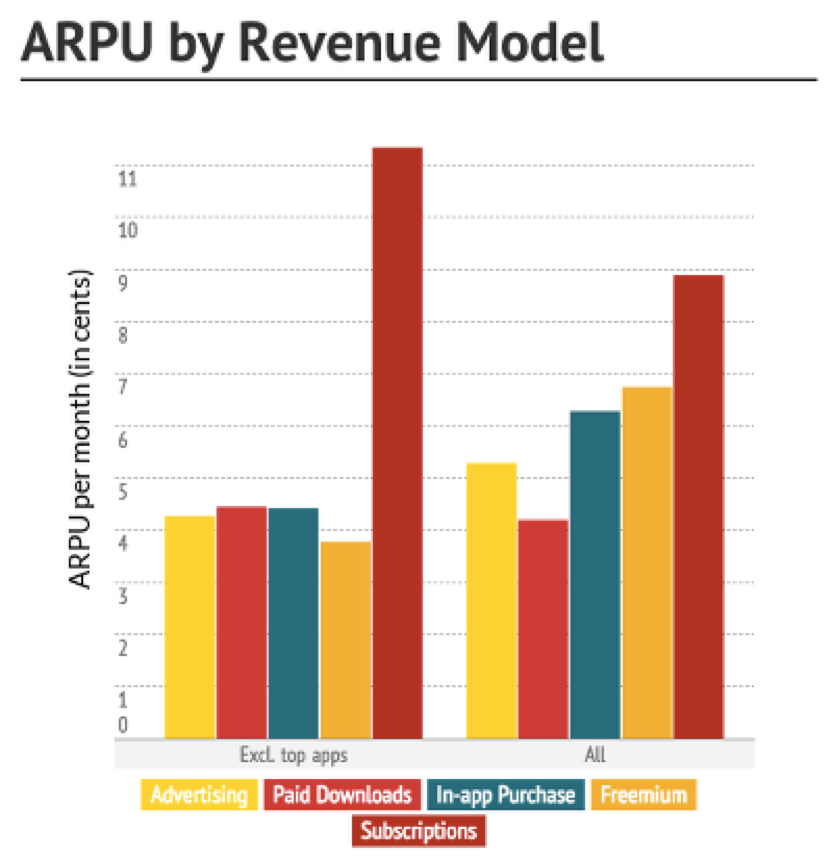
Average Revenue Per User (ARPU)
ARPU is the average revenue per user or the value of an individual to your app business for a particular month. You can calculate how much revenue you generate from each user. If you can keep your ARPU higher than Customer Acquisition Cost (CAC), you are making profit. Add the revenue your app generates each month and divide it by your total number of active users to calculate ARPU.
Life Time Value (LTV)
We have come to the essential part of the app performance metrics. Lifetime value (LTV) is your primary revenue metric, which represents the financial value of your app in relation to how much each user is worth in his or her lifetime, or the forecasted value of acquired user. To calculate LTV, use Customer Churn and Average Revenue Per User (ARPU). You can find the ARPU metric above. Churn rate indicates how many users leave over a given period. When you have calculated churn, you can take its inverse (1/Churn) to find the predicted amount of time a customer will spend engaged with your app. Then, you can obtain the LTV with this formula:
LTV = ARPU x (1/Churn)
We shared the fundamental app performance metrics with you. There are several metrics you can track. If you don’t want to leave your app success to chance, track the metrics that are the most important for your app.
Could not generate text at this time.
Retention is where the real story begins. While acquisition tells you how many users are stepping into your app’s world, retention reveals how many are sticking around and finding value in what you’ve built. Think of it as the heartbeat of your app—it’s not just about getting users, but keeping them engaged over time. Retention metrics help you identify trends, like whether users are coming back after the first download or if they’re drifting away after day one. A high retention rate means your app has something special—whether it’s seamless functionality, engaging content, or genuine problem-solving capabilities. On the flip side, a low retention rate signals it’s time to dig deeper and understand what’s missing. By tracking retention, you can fine-tune user experiences
Retention is another cornerstone metric that can make or break your mobile app’s success. After all, getting users to download your app is just the first step—keeping them engaged and coming back for more is where the real challenge lies. Retention metrics measure the percentage of users who continue to use your app over a specific time period, offering insights into how well your app delivers value and meets user expectations. A high retention rate often indicates that your app is solving a problem, providing entertainment, or offering utility that keeps users hooked. On the flip side, low retention rates can be a red flag, signaling issues like poor user experience, lack of engaging content, or even technical glitches. By analyzing retention rates, you can identify patterns, pinpoint drop-off moments