Ask ten marketers when Thanksgiving attention peaks and you will get ten confident answers. The data from the last two years suggests none of them should be trusted blindly: the busiest hours of Thanksgiving Day shifted from the evening to midday between 2024 and 2025. That makes Thanksgiving a good candidate for a test-and-learn approach rather than a fixed dayparting schedule.
This guide pulls together what credible sources say about when people shop and use apps around the holiday, then turns it into five hypotheses you can test with your own campaigns before Black Friday. One note on scope: most hourly data comes from U.S. online retail, not from ad impressions or app installs. Treat it as a map of where to look, not a rulebook.
What retail data says about Thanksgiving hours
The most useful public hourly data comes from Adobe Analytics, which measures online transactions across more than a trillion visits to U.S. retail sites, plus a few platform reports.
The peak moved. In 2024, Adobe found Thanksgiving online sales peaked between 8 p.m. and 10 p.m., as festivities wound down. In 2025, the peak came earlier, between 10 a.m. and 2 p.m. Shopify reported a similar picture for its U.S. merchants, with the peak sales hour at 11 a.m. Eastern.
Mobile dominates the day. Adobe recorded 61.6% of Thanksgiving online spend on mobile in 2025, up from 59.5% in 2024, the first time it crossed 60%. That was $3.9 billion, up 9.4%. For 2026, Adobe forecasts a 63% mobile share and $4.4 billion in mobile spend, up 11%. Salesforce's 2025 forecast went further, expecting Thanksgiving to have the highest mobile share of Cyber Week, at 80% of site traffic and 75% of orders (a global measure that is not directly comparable with Adobe's U.S. spend share).
Neighboring days have their own rhythms. On Black Friday 2025, Adobe measured the busiest period between 10 a.m. and 2 p.m., with shoppers spending 12. 5 million every minute. Shopify’s merchants saw their sharpest spike at 12:01 a.m. Eastern, right as early-morning deals went live. On Cyber Monday, Adobe measured the peak between 8 p.m. and 10 p.m. in both 2024 ($15.8 million a minute) and 2025 ($16 million a minute).
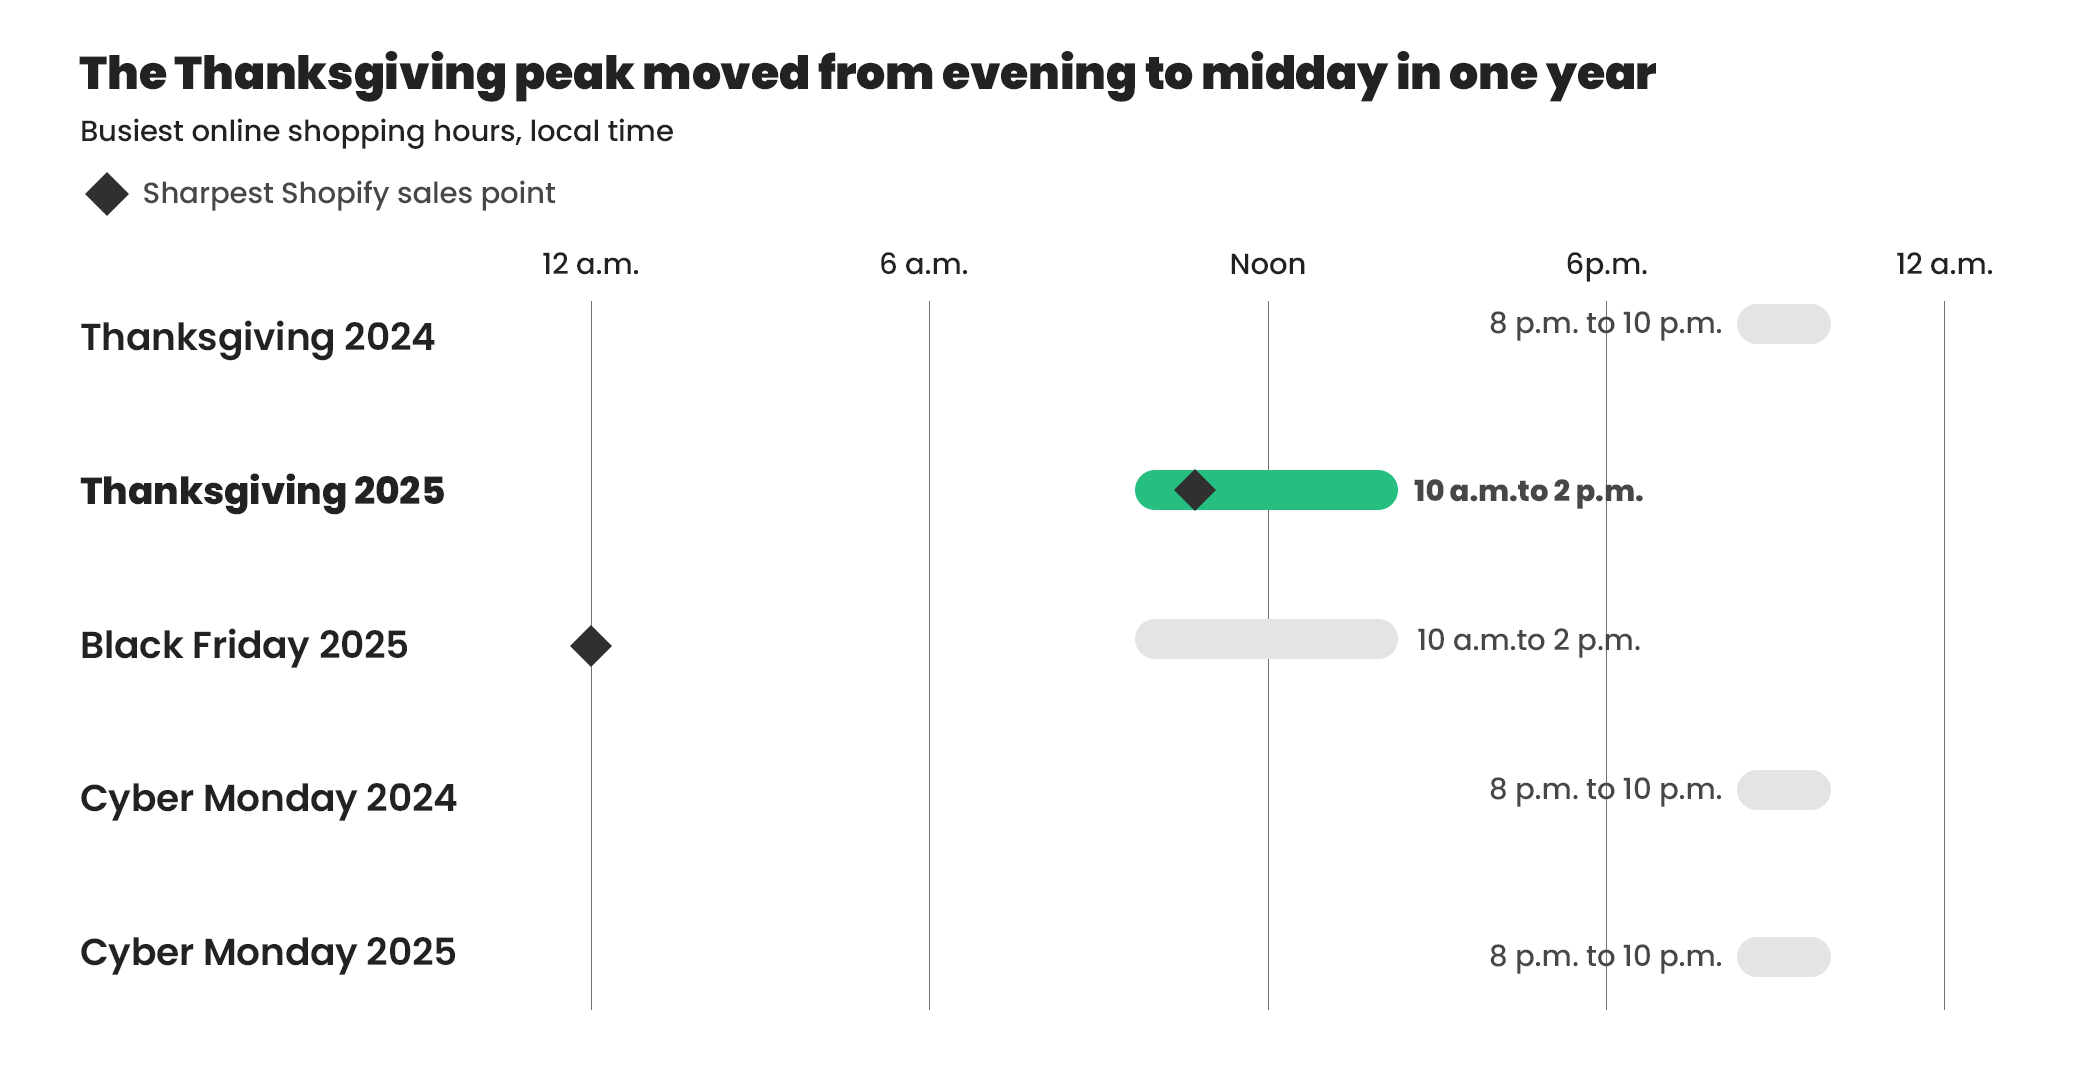
The lesson is that there is no single "Thanksgiving peak." Timing shifts by day, by year, and by when retailers choose to launch deals. Adobe's own commentary describes phone shopping happening both before gatherings and after the festivities wind down, which is why a midday window and an evening window both deserve a test.
What app-level data adds
Retail transaction data tells you when people buy. App data tells you where attention and competition sit.
More time, fewer new installs. Sensor Tower's State of Mobile 2026 report estimates people spent 5.3 trillion hours in apps in 2025, about 3.6 hours a day per user. Time spent grew faster than downloads, which were close to flat (up 0.8%). In practice, people are doing more inside the apps they already have. That favors campaigns that reach existing app users, such as retargeting and re-engagement, alongside acquisition.
Retail apps are fighting for a flatter pie. The same report says growth in retail app engagement slowed sharply in 2025: downloads declined, and time spent growth fell to around 1% after roughly 10% in each of the two prior years, as expansion from large global players slowed. Competition for the same attention is intense.
Finance is moving differently. Sensor Tower found Credit and Lending app downloads rose 18% in 2025, while investing and crypto apps declined. Finance does not behave like one category, so a shopping schedule may not fit a lending app.
Black Friday downloads split by platform. Appfigures estimates U.S. shopping app downloads reached 69 million in November 2025, up 10% year over year. On Black Friday itself, App Store downloads rose 8.2% while Google Play downloads fell 2.2%. The takeaway for dayparting: test iOS and Android separately rather than assuming they move together.
General time-of-day studies point to evenings. Older U.S. research from Localytics (January 2015 data) found overall app sessions peaking around 8 p.m. to 9 p.m. local time, with finance and business apps seeing heavy use through the day and into the evening. Academic session studies similarly find phone use is moderate in the daytime and intensifies in the evening. These are dated and not specific to holidays, so treat them as a starting point rather than proof.
Holiday behavior is different from normal behavior. A Pinterest engineering study of Thanksgiving 2016 found planning-style search sessions rose in the days before the holiday, while click-through sessions spiked on the day itself. It covers one platform and one year, but it supports the idea that intent changes across the Thanksgiving week, not just across the hours of one day.
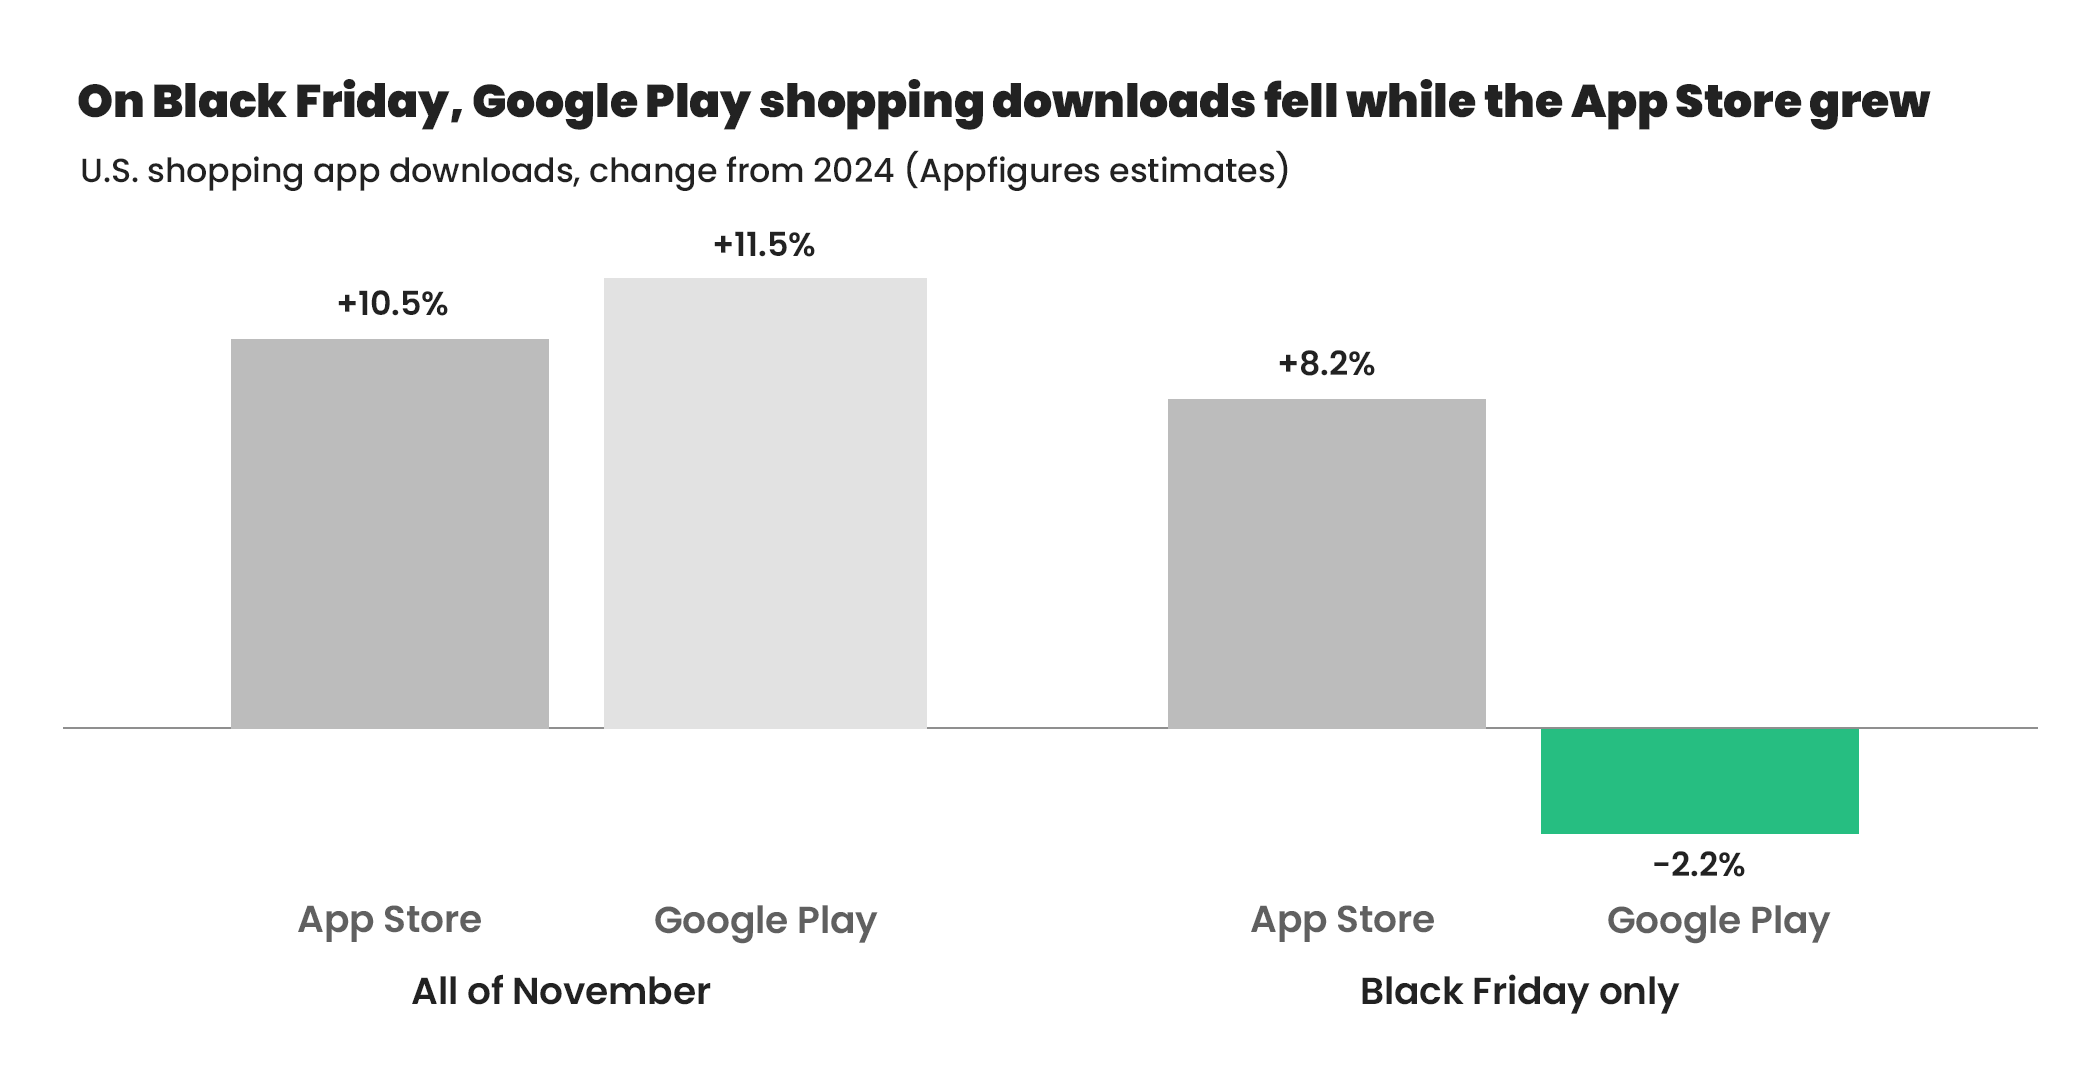
The month as a whole lifted both stores, but Black Friday did not, so test each platform on its own.
Five hypotheses worth testing
Each one is a guess to confirm or reject with your own data. None is a recommendation to change bids permanently.
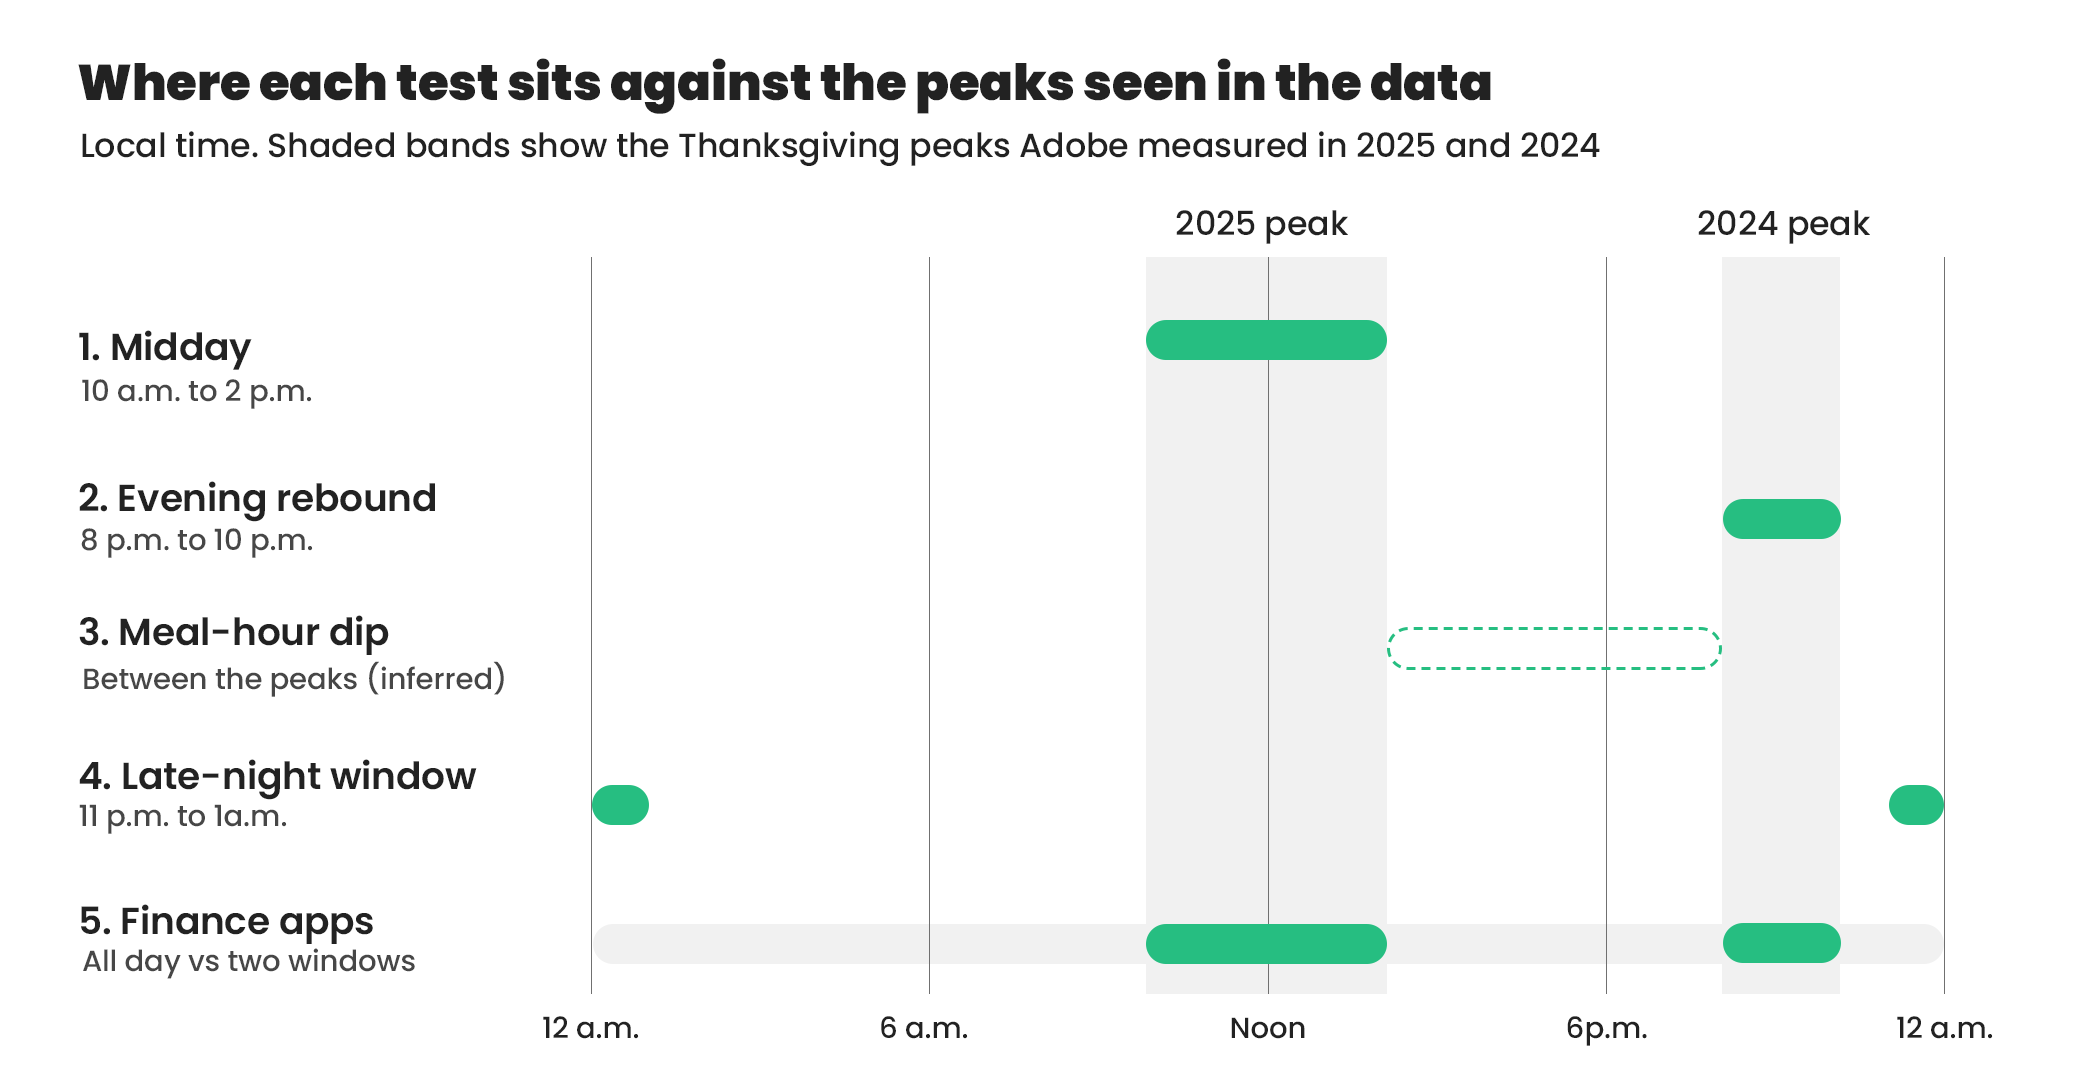
The shaded bands are the two Thanksgiving peaks seen in 2024 and 2025. Hypothesis 3 is dashed because it is inferred rather than measured.
1. Midday is the new peak
Why we think so: Adobe and Shopify both saw a late-morning to early-afternoon peak in 2025. How to test: Raise bids by a modest step (10-20% is a reasonable starting range) between 10 a.m. and 2 p.m. local time, and compare conversion rate and cost per action against a matched, unboosted time block.
2. The evening rebound returns
Why we think so: The 2024 Thanksgiving peak was 8-10 p.m., Cyber Monday peaks there in both years, and general app usage skews toward evenings. How to test: Run a bid lift between 8 p.m. and 10 p.m. local time and measure whether it outperforms the midday window. If the 2024 pattern returns, this is where it will show.
3. The meal hours are a trough
Why we think so: If activity peaks before and after the gathering, attention may dip in between. This is an inference. None of the sources above measure a dip directly. How to test: Lower bids, or cap budget, in the hours around your region's typical dinner time for one cell and leave a control untouched. If cost per action improves and conversions barely change, you have found savings. If conversions fall, you have learned that the dip is not real for your audience.
4. Late-night intent follows the deal clock
Why we think so: Shopify's sharpest Black Friday minute came just after midnight, when deals went live, and shoppers browse on their phones while deals are about to drop. How to test: Time retargeting for cart abandoners and wishlist viewers between 11 p.m. and 1 a.m. to your own deal launch, not just the clock. Compare against a daytime retargeting cell with the same offer.
5. Finance apps follow a flatter curve
Why we think so: Older time-of-day research shows finance apps with steady use across the day and evening, and finance subcategories are moving in different directions. Flexible payment options are also a mobile-heavy behavior: Adobe reported $447.7 million in BNPL spend on Thanksgiving 2025, and about 81% of Black Friday BNPL purchases happened on mobile. How to test: Run a separate schedule for finance campaigns and compare an all-day approach against a two-window approach (midday and evening). Keep promotional creative reviewed by compliance before it goes live.
How to run the test properly
A dayparting test is only as good as its design. A few rules keep the results honest:
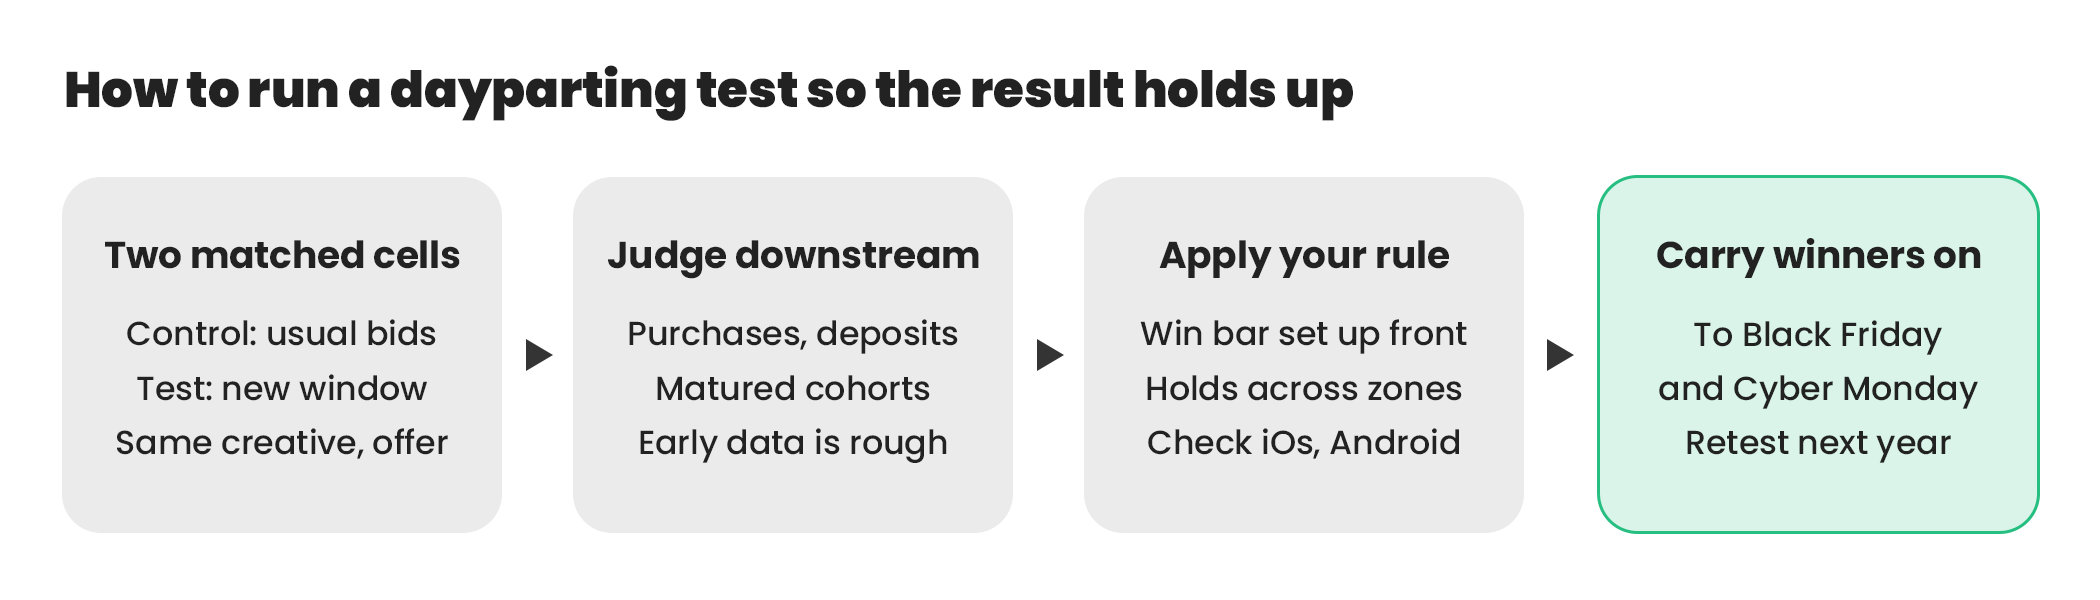
Every test follows the same path, so Thanksgiving results can be compared with Black Friday and Cyber Monday.
Change one thing at a time. Keep creative, audience, and offer identical across test cells so the only difference is the time window or bid.
Use local time. Adobe's peak hours are measured by local time, so schedule by the user's time zone, not your own.
Split by platform. Given the iOS and Android divergence on Black Friday, set up separate cells for each where volume allows.
Lock your budget rules first. If daily caps or pacing are uneven across cells, they will distort the results. Set budget guardrails before you test (our Black Friday guide covers this in detail).
Judge on downstream actions. Look at purchases, funded accounts, or completed applications, not only clicks and installs. Because attribution can lag, especially on iOS, treat early results as provisional and look at matured cohorts.
Set decision rules in advance. Agree on the threshold that counts as a win (for example, a cost per action improvement that holds across two time zones) before you see the numbers.
Thanksgiving is one observation, so plan accordingly
Thanksgiving is a single day, and one day is a small sample. A sensible approach is to run a pre-test in the week before (Nov 16-25), apply the leading hypotheses on Thursday, and then carry the survivors into Black Friday and Cyber Monday, where volume is higher and you can confirm what held. Whatever you learn, record it with the year attached. The shift from 2024 to 2025 is a reminder that a pattern that held last year may not hold this year.
What would change the plan
If your own hourly data from last Thanksgiving shows a clear pattern, weight it over any public source, because it reflects your audience.
If a major competitor launches deals early, expect your peak hours to shift with their promotions.
If cost per action rises sharply in a test window without a matching rise in conversions, stop and review before the next day.
The bottom line
The evidence does not support a single Thanksgiving schedule, it supports a short list of well-motivated guesses: midday, evening, a possible meal-hour dip, a late-night deal window, and a different curve for finance. Test them with disciplined design, keep what works, and be ready to change it next year.
If you would like help setting up programmatic dayparting tests ahead of the holiday, reach out to the AppSamurai team!