
{“@context”:”https://schema.org”,”@type”:”FAQPage”,”mainEntity”:[{“@type”:”Question”,”name”:”How can you become one of the 6% that keep their users?n”,”acceptedAnswer”:{“@type”:”Answer”,”text”:”If app crashes cause 71% of uninstalls, we can increase the chances of your mobile app succeeding by understanding your mobile crashes and fixing them quickly.nHere are seven metrics that will give you a better idea of the quality of your application and prevent uninstalls caused by crashes and performance problems. (For a list of tools that help you measure these metrics, read this blog post on Crash Reporting tools.)”}},{“@type”:”Question”,”name”:”Total Users, New Users, And Return Raten”,”acceptedAnswer”:{“@type”:”Answer”,”text”:”The amount of user growth your app has is the first indicator of the success of your mobile app, so you need to monitor total users and new users closely. The number of users will give the broader team the data they need to understand everything from revenue and budgeting, to hiring.nThe return rate is the average number of sessions of one user completes over a given time frame.nnAs a technical team, these user metrics serve as an improvement indicator and where to focus resources. For example, you might see that the return rate is declining. To improve this rate, you might want to create push notifications incentivizing users to come back.”}},{“@type”:”Question”,”name”:”Total Sessionsn”,”acceptedAnswer”:{“@type”:”Answer”,”text”:”Total sessions refer to the number of times users logged into your application over a specific timeframe.nThis is especially important for understanding how people use your application and establishing usage trends like which times of day users are logging in. You can correlate total user sessions to total user count to understand your application’s engagement metrics.nA real user monitoring tool will be able to give you valuable information on users, including correlating performance problems to the times of day that are most frequented by your users.”}}]}
The mobile app world is competitive. In March 2018, the number of available apps in the Google Play Store was 3.6 million. An analysis by Uninstall.io, 94% of users uninstall mobile apps after 30 days from download.
-How can you become one of the 6% that keep their users?
If app crashes cause 71% of uninstalls, we can increase the chances of your mobile app succeeding by understanding your mobile crashes and fixing them quickly.
Here are seven metrics that will give you a better idea of the quality of your application and prevent uninstalls caused by crashes and performance problems. (For a list of tools that help you measure these metrics, read this blog post on Crash Reporting tools.)
Total Users, New Users, And Return Rate
The amount of user growth your app has is the first indicator of the success of your mobile app, so you need to monitor total users and new users closely. The number of users will give the broader team the data they need to understand everything from revenue and budgeting, to hiring.
The return rate is the average number of sessions of one user completes over a given time frame.
As a technical team, these user metrics serve as an improvement indicator and where to focus resources. For example, you might see that the return rate is declining. To improve this rate, you might want to create push notifications incentivizing users to come back.
Total Sessions
Total sessions refer to the number of times users logged into your application over a specific timeframe.
This is especially important for understanding how people use your application and establishing usage trends like which times of day users are logging in. You can correlate total user sessions to total user count to understand your application’s engagement metrics.
A real user monitoring tool will be able to give you valuable information on users, including correlating performance problems to the times of day that are most frequented by your users.
Median Session Length
Median session length offers an accurate time-frame from when a user opened your application to the time they closed it.
Alongside total sessions, median session length is another vital engagement metric. Why measure the median, not the average? Averages tend to lie; they don’t offer a natural representation of your users.
There can be any number of reasons your median session length can dip below the expected rate. The average time a user spends in an app varies between industries. For example, you can expect around 2.61 minutes per user in technology apps to 7.55 minutes per user in gaming applications.
% Crash-Free Users
Crash-free users refer to the number of users that have not experienced any errors in a given time frame.
Crashes are a significant concern for mobile app users, with USamp discovering that 62% of people uninstall an app if they experience crashes or errors. So ideally, this percentage should be as low as possible. The average crash rate for mobile is 1 – 2%, so aim for 98% crash-free users.
The best way to lower this percentage is to set a benchmark and aim to improve it using testing and code review processes. From there, you can start to understand which errors are directly affecting user experience, so that you can prioritize development time. For example, a third-party script may be causing slow load times, so you may want to look at removing it.
Your development team can quickly assess the crash free user % by using a crash and error reporting tool.
Average Load Time Per Session
Average load time per session measures how long a user was kept waiting in total from the time they logged in to the time they left your app.
Maintaining a fast mobile application load speed is critical, and keeping a user waiting just three seconds is enough to put off 43% of users.
Latency is the time it takes for the host server to receive and process a request for an asset.
A poor API is a big culprit of page load speed being too long, but it’s not the whole story. You’ll need to measure the following to build a picture of where you might be lacking:
- DNS: Time it takes for the nameserver lookup to resolve
- Latency: Time it takes for the host server to receive and process a request for an asset
- SSL: Time to complete an SSL handshake
- Server: Time it takes for the server to compute your code
- Transfer: Time the page has to wait for assets to load from the server
- Render: Time it takes the browser to apply stylesheet rules and compute JavaScript
- Children: Time for asynchronous assets to process – this refers to all requests loaded by the page up until onLoad (includes scripts, stylesheets, images, and XHR requests)
To keep this metric as low as possible, follow best practices for reducing image sizes and front-end load times.
User Satisfaction
A user satisfaction score is an indicator of an average user’s experience based on page load speeds and crash rates. Use metrics above to determine if your user satisfaction is low or high, and monitor over time. A simple guideline is enough.
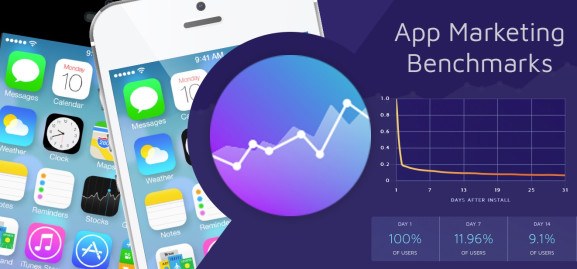
Bonus: App Marketing Benchmarks – Adjust
Lastly, we want to talk about “App Marketing Benchmarks by Adjust“. It tells you how your app/game is doing compared to everyone else. To ensure a clean data set, they calculated an average retention rate, sessions per user, and events per user on a per-app basis for every combination of vertical, region, user type, and platform (an average of all 31 cohort days’ values). All in all, it gives you all remarkable insights you need to scale your business.
Final Thoughts
Developing and running mobile applications is expensive, and benchmarking metrics is the only way to ensure your application is succeeding.
Users have high expectations, and you can’t afford to let slow loading pages and broken third-party scripts ruin your chances of success. Provide your users with the best possible experience, and they will keep coming back for more.
Could not generate text at this time.