In today’s data-driven app economy, understanding user behavior isn’t just advantageous—it’s essential for survival. Mobile app analytics tools provide the critical insights that differentiate successful apps from those that fade into obscurity. With over 5.7 million apps competing for attention across app stores, the ability to measure, analyze, and optimize user experiences has become the cornerstone of sustainable growth.
Before diving into specific tools, let’s establish a clear framework for selecting the right analytics solution for your unique needs:
- Business Objectives Alignment: Determine whether your primary focus is user acquisition, engagement, retention, monetization, or a combination of these goals.
- Technical Implementation Requirements: Assess your development team’s capacity for integration complexity and ongoing maintenance.
- Budget Considerations: Evaluate free, freemium, and enterprise-level options against your expected ROI.
- Data Privacy Compliance: Ensure the solution supports your obligations under GDPR, CCPA, and other relevant regulations.
- Scalability Potential: Confirm the platform can grow alongside your user base without performance degradation.
With these criteria in mind, let’s explore the 10 most powerful mobile app analytics platforms in 2025, complete with practical implementation insights and specific business use cases.
Also, don’t forget to check out our comprehensive guide on App Engagement Benchmarks: Measuring Success in Mobile User Acquisition to learn which specific metrics you should monitor for effective user acquisition and monetization strategies.
Apple Analytics
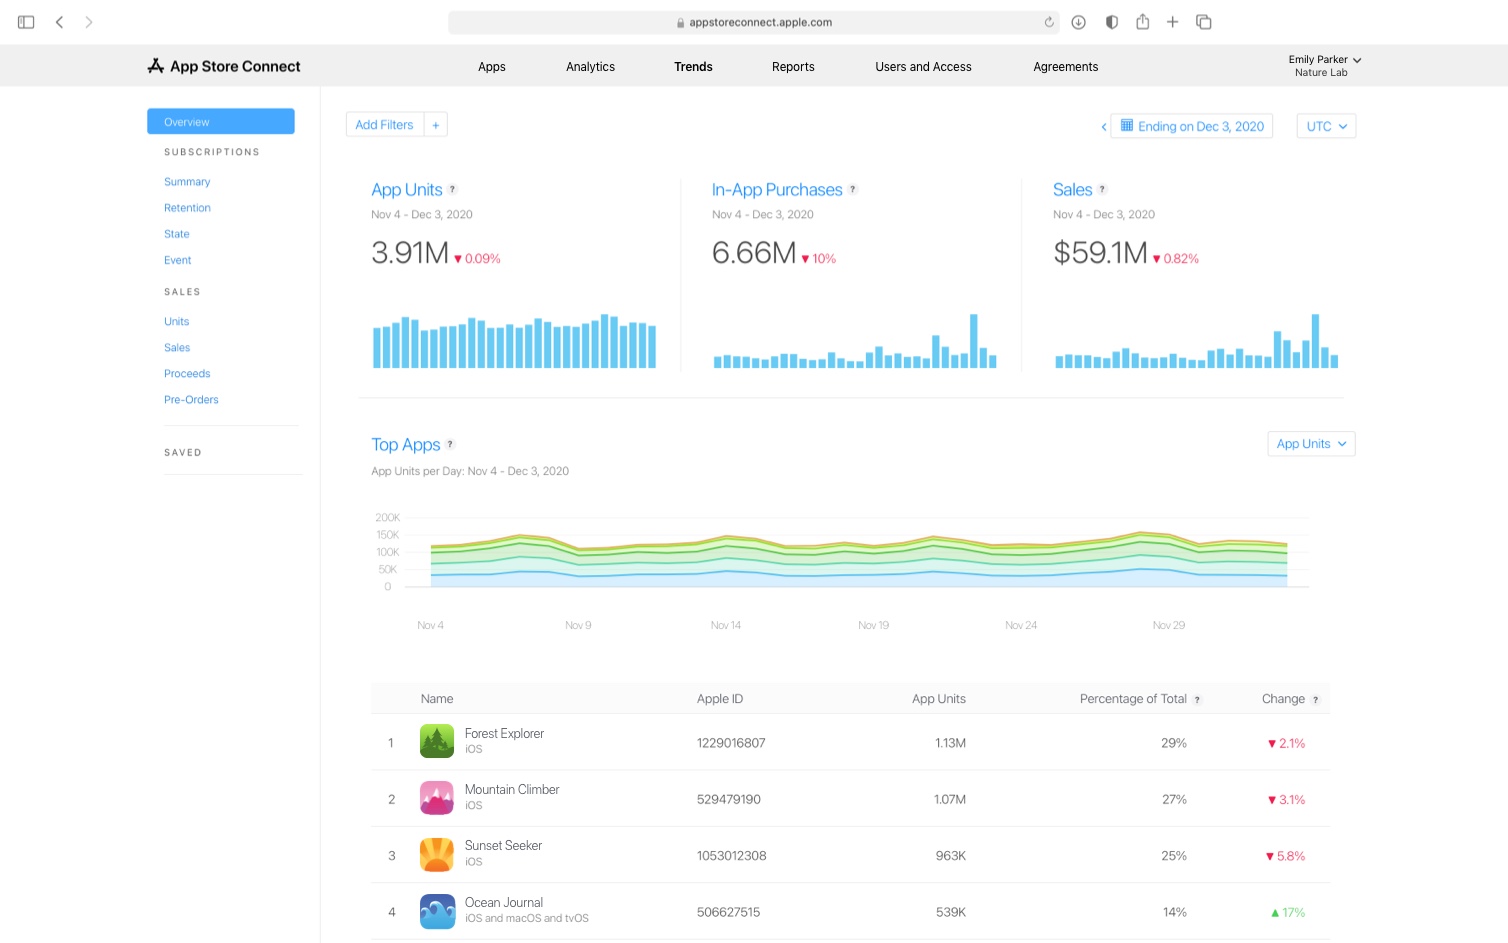
Apple Analytics provides iOS developers with comprehensive insights into app performance across the Apple ecosystem. Its direct integration with the App Store gives it unparalleled accuracy in tracking attribution and user behavior within the iOS environment.
Key Features:
- User Engagement Tracking: Monitor session duration, frequency, and active devices with cohort segmentation capabilities.
- Retention Analysis: Measure user retention across customizable time periods (1-day, 7-day, 30-day, and custom intervals).
- Marketing Campaign Attribution: Track campaign performance with granular source attribution for App Store traffic.
- Revenue Analytics: Access detailed breakdowns of in-app purchase patterns, subscription conversions, and revenue trends.
Pricing:
- Free: Available to all developers with an active Apple Developer account ($99/year) and at least one published app.
Implementation Case Study:
A meditation app developer used Apple Analytics to discover that users who completed the onboarding tutorial had 3.5x higher subscription conversion rates. By identifying the specific screens where drop-offs occurred during onboarding, they redesigned the experience and increased completion rates by 27%, directly impacting their subscription revenue.
Pros:
- Native Integration: Seamlessly works within the Apple ecosystem without additional SDK implementation.
- Privacy-Centric: Aligns with Apple’s privacy framework, maintaining compliance with evolving regulations.
- Reliable Attribution: Provides the most accurate attribution data for iOS app installs from App Store sources.
Cons:
- Platform Limitation: Only available for iOS apps, requiring separate solutions for cross-platform analytics.
- Limited Customization: Offers fewer customization options compared to specialized third-party tools.
- No Real-time Data: Reports typically update every 24 hours rather than providing real-time insights.
Branch.io
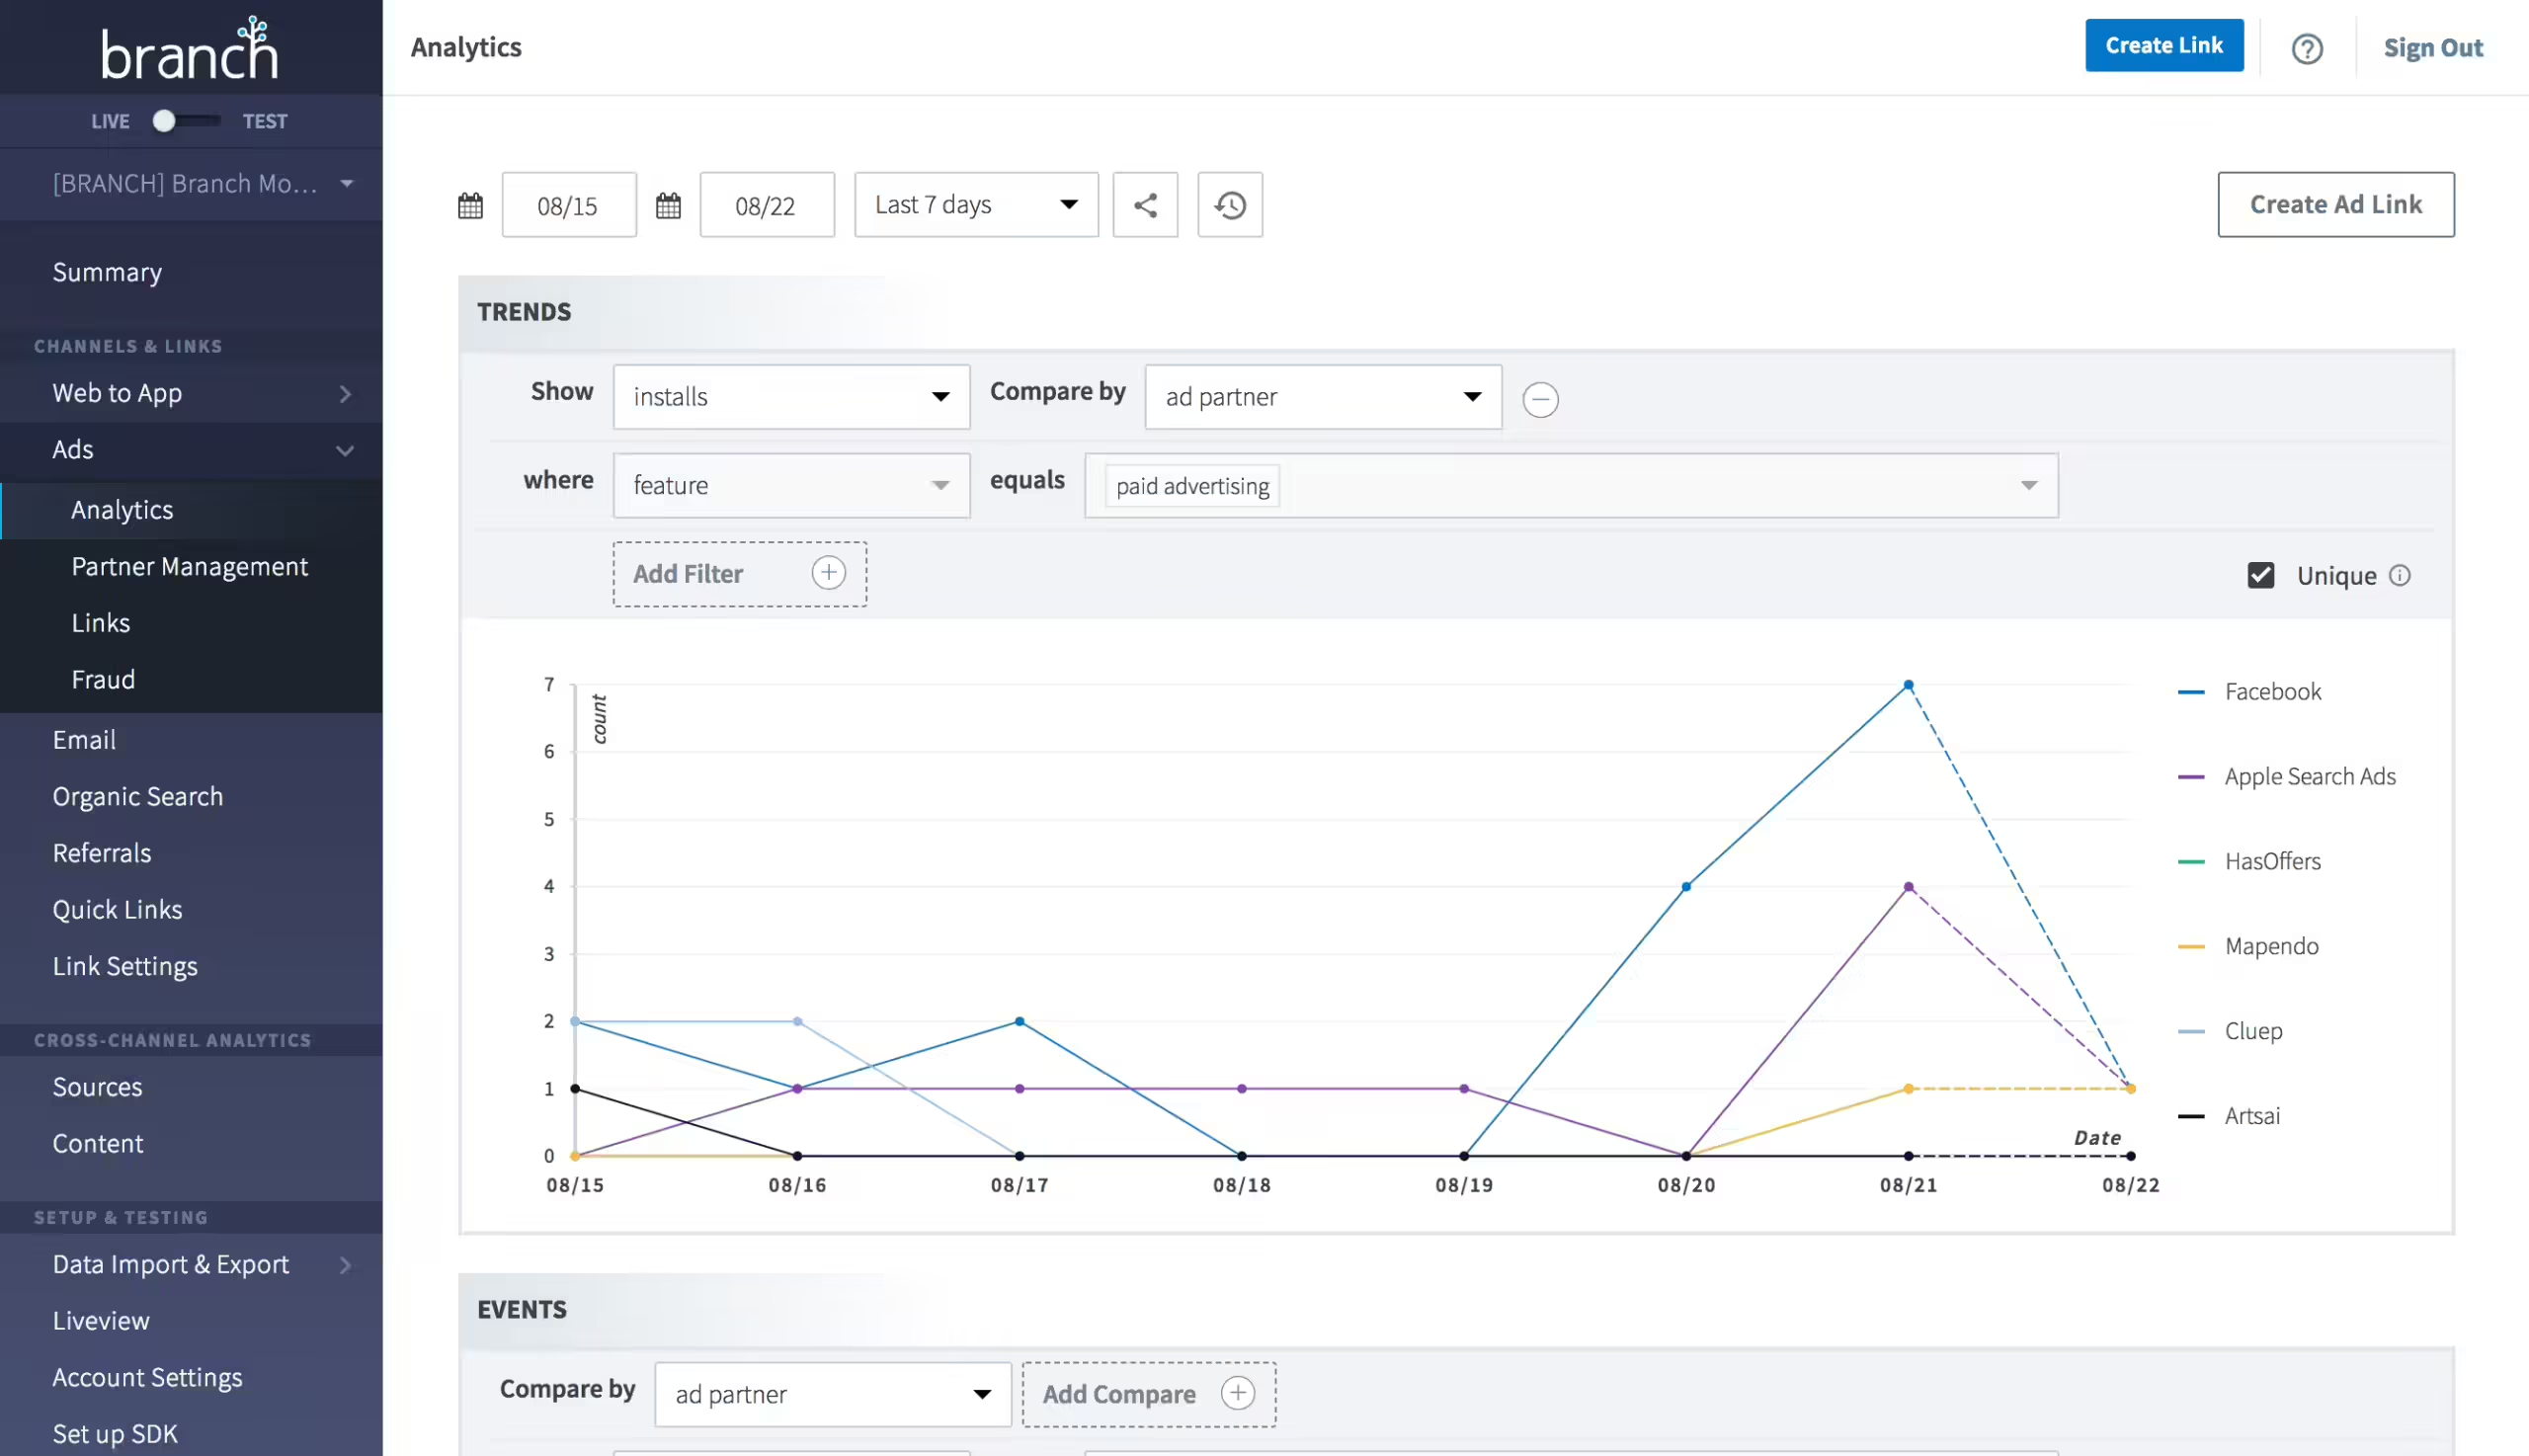
Branch.io has evolved from a deep linking solution into a comprehensive mobile measurement platform that specializes in cross-platform user journey tracking. Its attribution capabilities have become particularly valuable in the post-IDFA era, where traditional attribution methods face increasing challenges.
Key Features:
- Cross-Platform Deep Linking: Create seamless user journeys across platforms, devices, and marketing channels with intelligent routing.
- Advanced Attribution: Measure campaign effectiveness with probabilistic and deterministic attribution models that adapt to privacy changes.
- Journey Visualization: Map complete user paths from acquisition through conversion with touchpoint analysis.
- Fraud Prevention: Identify and filter fraudulent installs and activities with ML-powered detection systems.
Pricing:
- Free Plan: Available for apps with up to 10,000 monthly active users with limited features.
- Growth Plan: Starting at $799/month with expanded capabilities.
- Enterprise Plan: Custom pricing for large-scale implementations with advanced needs.
Implementation Case Study:
An e-commerce app implemented Branch.io’s deep linking to create personalized user journeys from email campaigns directly to specific product pages. This implementation reduced the path to purchase by eliminating navigation steps, resulting in a 32% increase in conversion rates from email marketing campaigns and providing clear attribution data for their marketing team.
Pros:
- Unified Attribution: Provides consistent measurement across channels, platforms, and devices.
- Privacy-Forward Solution: Designed to maintain effectiveness despite increasing privacy restrictions.
- Extensive Integrations: Connects with over 300 partners in the marketing technology ecosystem.
Cons:
- Technical Complexity: Requires significant developer resources for proper implementation and maintenance.
- Feature Overwhelm: The extensive feature set can be overwhelming for smaller teams.
- Cost Scaling: Pricing can increase substantially as user volumes grow beyond initial tiers.
Singular
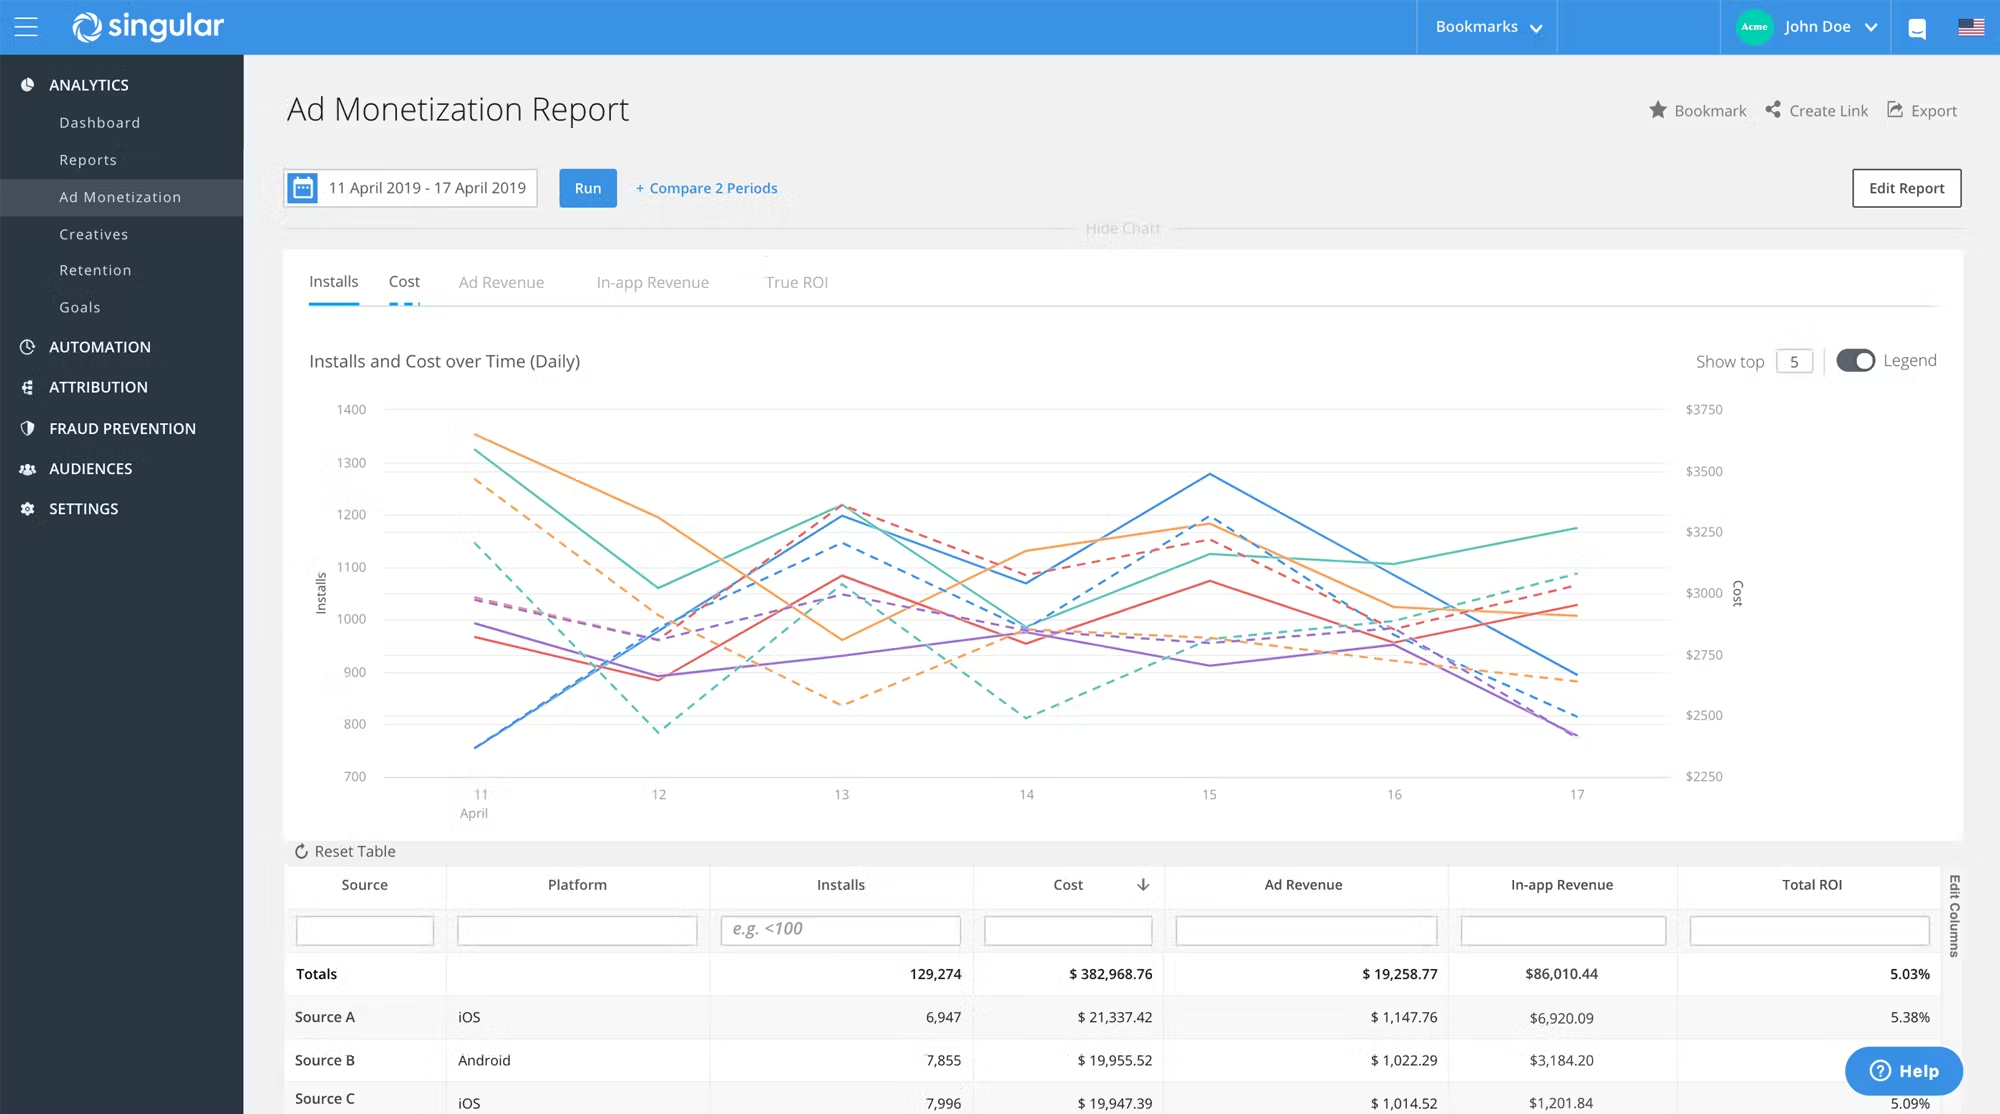
Singular positions itself as a marketing intelligence platform that unifies attribution data with marketing spend information. This integration provides marketers with true ROI visibility across channels—a critical capability for optimizing acquisition efficiency in competitive markets.
Key Features:
- Marketing ROI Analysis: Connect campaign performance with actual cost data for accurate return calculations.
- Cross-Channel Attribution: Attribute conversions across various marketing touchpoints with customizable attribution models.
- Cost Aggregation: Automatically collect spending data from advertising platforms into unified reports.
- Predictive Analytics: Use AI-powered forecasting to predict future performance based on historical patterns.
Pricing:
- Custom Pricing: Based on monthly tracked installs, active users, and required features.
Implementation Case Study:
A mobile gaming company used Singular to consolidate data from 15 different ad networks and identify that their TikTok campaigns were delivering 40% higher ROI than Facebook for similar audience segments. This discovery allowed them to reallocate $500,000 in quarterly ad spend, resulting in a 27% overall improvement in customer acquisition costs while maintaining growth targets.
Pros:
- Comprehensive Cost Analysis: Excels at connecting spending data with performance outcomes.
- Fraud Detection: Advanced mechanisms to identify and filter fraudulent installs and activities.
- Data Normalization: Standardizes reporting across disparate platforms with different metrics.
Cons:
- Implementation Complexity: Requires significant setup effort and ongoing management.
- Learning Curve: Sophisticated platform demands time investment to fully leverage capabilities.
- Enterprise Focus: May offer less value for smaller apps with limited marketing channels.
Mixpanel
Mixpanel specializes in product analytics with a focus on understanding user behavior through event-based tracking. Its strength lies in helping product teams answer specific questions about how users interact with features, enabling data-driven product development decisions.
Key Features:
- Event Tracking: Monitor specific user actions with customizable properties and metadata.
- User Flow Visualization: See how users navigate through your app with path analysis tools.
- Advanced Segmentation: Slice user data across multiple dimensions for targeted analysis.
- A/B Testing: Experiment with feature variations and measure performance differences.
- Predictive Insights: Use machine learning to anticipate user behaviors and conversion likelihood.
Pricing:
- Free Plan: Up to 100,000 tracked users with core analytics features.
- Growth Plan: Starting at $25/month with expanded capabilities.
- Enterprise Plan: Custom pricing with advanced security, support, and integration options.
Implementation Case Study:
A subscription-based fitness app implemented Mixpanel to analyze workout completion patterns. They discovered that users who completed at least three workouts in their first week were 5x more likely to convert to paid subscribers. This insight led to a redesigned first-week experience with simplified, shorter workouts and enhanced notifications, increasing week-one engagement by 47% and ultimately lifting conversion rates by 23%.
Pros:
- Intuitive Interface: User-friendly design allows non-technical team members to build complex queries.
- Powerful Query Engine: Flexible system for analyzing user behaviors across multiple dimensions.
- Real-time Data: Provides immediate visibility into user interactions as they occur.
Cons:
- Event Planning Required: Requires thoughtful implementation planning for effective tracking.
- Data Sampling: May use sampling for high-volume events, affecting precision for some analyses.
- Limited Marketing Attribution: Not designed as a primary attribution solution for acquisition campaigns.
Localytics (Acquired by Upland Software)
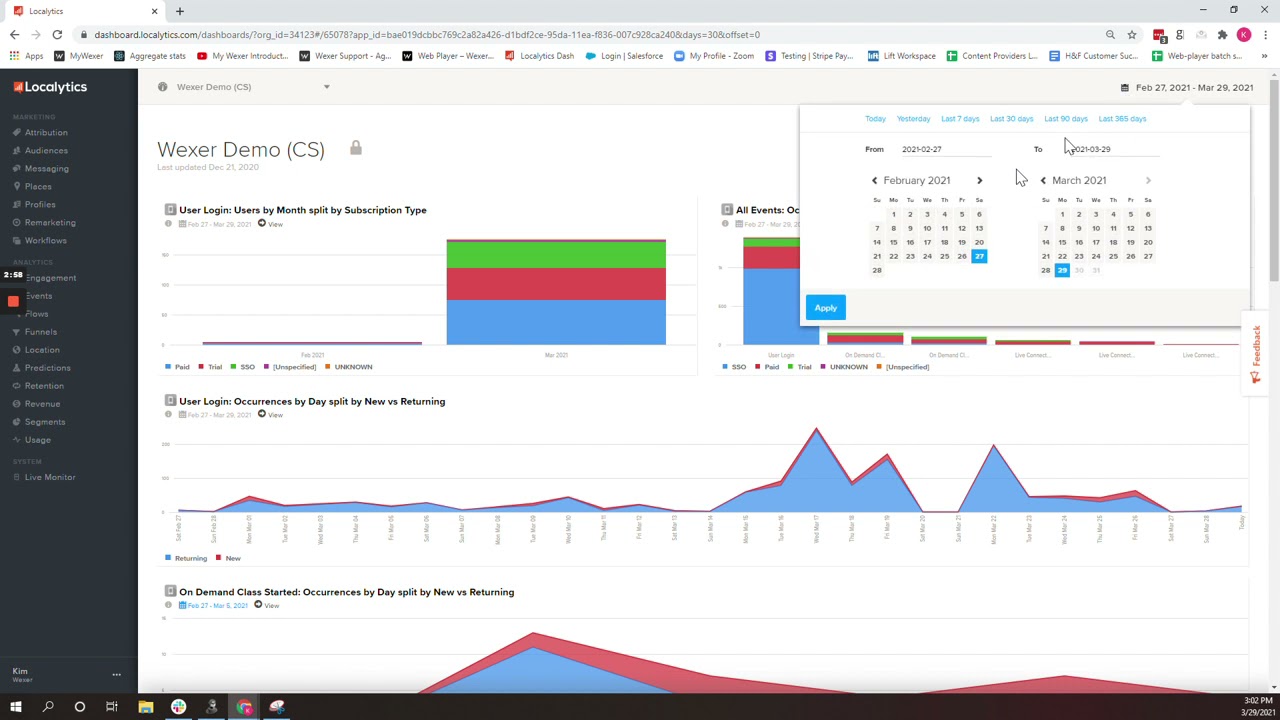
Now part of Upland Software’s mobile engagement platform, Localytics combines analytics with marketing automation capabilities. This integration enables teams to not only analyze user behavior but also act on those insights through personalized messaging campaigns.
Key Features:
- Behavioral Analytics: Track user interactions and identify engagement patterns.
- Automated Marketing: Trigger personalized messages based on user behavior and segments.
- Predictive Churn Analysis: Identify users at risk of abandonment before they leave.
- Cohort Comparison: Compare behavior across different user segments and time periods.
Pricing:
- Custom Pricing: Based on monthly active users and messaging volume.
Implementation Case Study:
A food delivery app used Localytics’ predictive churn analysis to identify users showing declining engagement patterns. They implemented an automated re-engagement campaign targeting users with personalized offers based on their past ordering behavior. This targeted approach recovered 18% of at-risk users who would have otherwise churned, generating $430,000 in additional annual revenue.
Pros:
- Integrated Marketing Tools: Combines analytics with direct action capabilities.
- Audience Segmentation: Sophisticated targeting based on behavior, demographics, and usage patterns.
- Retention Focus: Specialized tools for improving user retention and lifetime value.
Cons:
- Integration Complexity: Full implementation requires significant development resources.
- Enterprise Pricing: Cost structure may be prohibitive for smaller applications.
- Post-Acquisition Changes: Some features have evolved following the Upland acquisition.
UXCam

UXCam specializes in qualitative analytics through session recordings, heatmaps, and user experience analysis. Rather than just telling you what users do, it shows you how they interact with your interface, revealing friction points that quantitative data alone might miss.
Key Features:
- Session Recordings: Watch actual user interactions with your app to identify usability issues.
- Heatmaps: Visualize touch patterns to understand where users focus their attention.
- Rage Tap Detection: Identify user frustration through interaction pattern analysis.
- Screen Flow Analysis: See how users navigate between screens and where they encounter problems.
- Automatic Issue Detection: AI-powered identification of UI problems and conversion blockers.
Pricing:
- Free Plan: Up to 1,000 monthly sessions with core features.
- Growth Plan: Starting at $199/month for up to 10,000 sessions.
- Enterprise Plan: Custom pricing with advanced security and support options.
Implementation Case Study:
A financial services app used UXCam to investigate why 62% of users abandoned their account creation process. Session recordings revealed that the password creation screen was causing significant confusion due to unclear requirements. After redesigning this screen with real-time validation feedback, completion rates improved by 41%, directly increasing new customer acquisition with no additional marketing spend.
Pros:
- Visual Insights: Provides direct visual evidence of user experience issues.
- Easy Implementation: Simple SDK integration with minimal configuration requirements.
- Privacy Conscious: Built-in features to automatically hide sensitive information.
Cons:
- Storage Limitations: Session recording data can consume significant storage on higher-traffic apps.
- Sample Size Constraints: May not capture every session depending on plan limitations.
- Battery Impact: Recording functionality can affect device battery performance.
AppMetrica
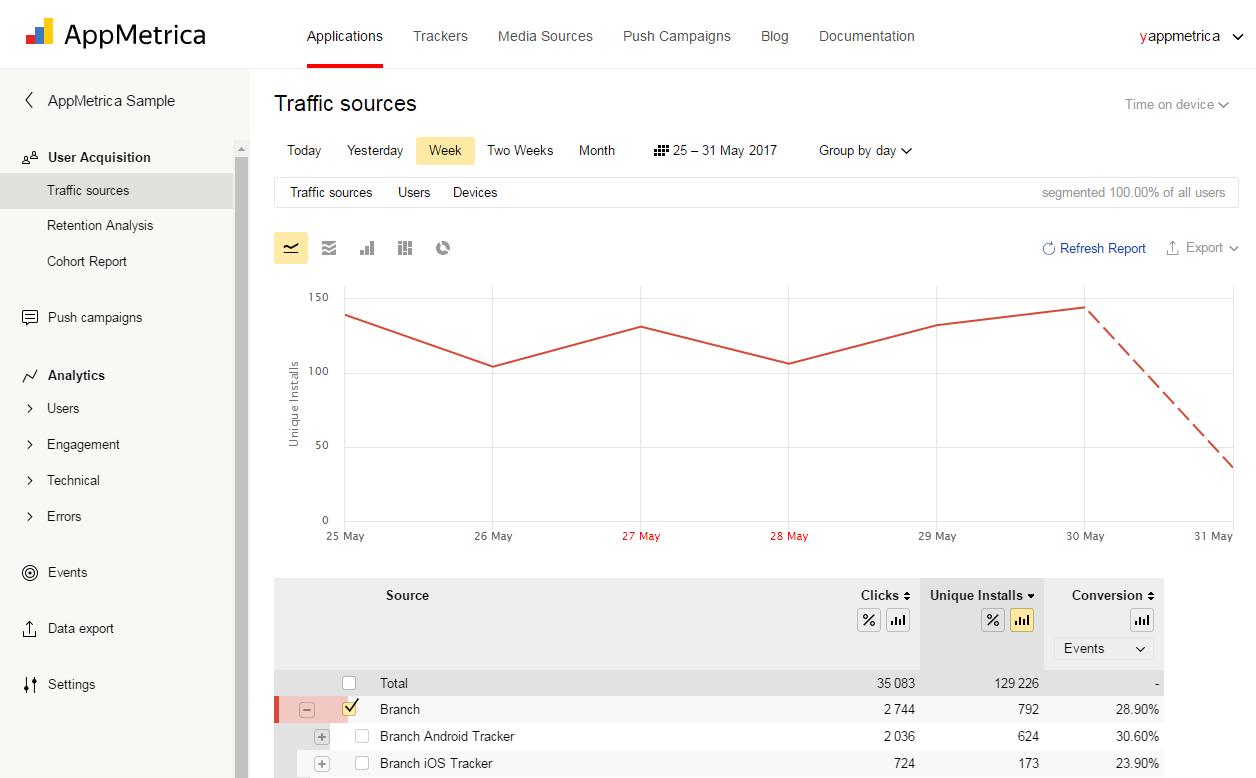
Developed by Yandex, AppMetrica offers a comprehensive analytics platform with particularly strong capabilities for apps targeting international markets, especially in Eastern Europe and Asia. Its free availability regardless of scale makes it an attractive option for growing applications.
Key Features:
- Real-Time Analytics: Monitor user activity as it happens with minimal delay.
- Custom Event Tracking: Define and monitor specific in-app events and conversion funnels.
- Crash Analysis: Identify and diagnose app crashes with detailed technical reports.
- User Profile Management: Build comprehensive user profiles across multiple dimensions.
- Revenue Analysis: Track in-app purchase patterns and revenue attribution.
Pricing:
- Free: Unlimited events, users, and sessions without feature restrictions.
Implementation Case Study:
A mobile gaming developer used AppMetrica to analyze user behavior across different geographic regions. They discovered that players in Southeast Asian markets spent 3x more time in tutorial sections compared to Western European users. This insight led to region-specific tutorial adaptations, improving completion rates by 45% in Asian markets and increasing overall player retention by 28% in those regions.
Pros:
- Comprehensive Free Tier: Offers enterprise-level features without cost restrictions.
- International Focus: Strong performance in global markets, especially Eastern Europe and Asia.
- Low Resource Impact: Efficient SDK with minimal impact on app performance.
Cons:
- Limited Integrations: Fewer third-party connections compared to some competitors.
- Interface Complexity: Steeper learning curve for non-technical users.
- Documentation Gaps: English documentation may lag behind Russian versions for newer features.
Heap Analytics
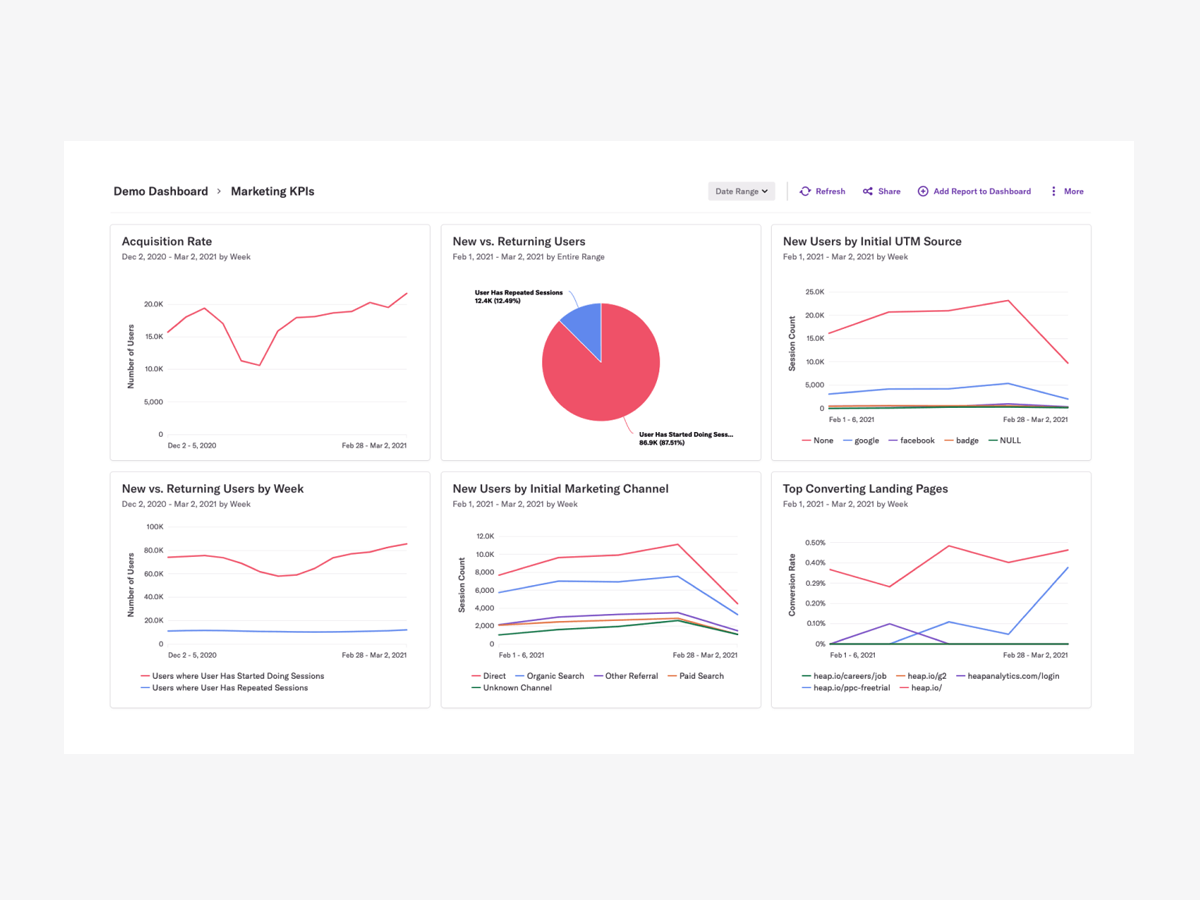
Heap’s unique “autocapture” technology sets it apart by automatically recording all user interactions without requiring predefined event tracking. This approach eliminates the risk of missing important behavioral data and allows retroactive analysis of previously untracked events.
Key Features:
- Automatic Event Capture: Record all user interactions without manual instrumentation.
- Retroactive Analysis: Define new events and analyze historical data without code changes.
- User Journey Mapping: Visualize complete user paths through your application.
- Conversion Funnel Analysis: Identify and optimize critical conversion pathways.
- Session Replay: View recordings of user sessions with integrated analytics context.
Pricing:
- Free Plan: Up to 10,000 sessions per month with core features.
- Growth Plan: Starting at $3,600/year with expanded capabilities.
- Enterprise Plan: Custom pricing with advanced features and dedicated support.
Implementation Case Study:
A productivity app used Heap’s autocapture capability to analyze their complete user journey without predefined event tracking. This revealed an unexpected pattern: users who accessed the calendar feature within their first three sessions were 4.7x more likely to become paid subscribers. The team had never specifically tracked calendar usage, but Heap’s retroactive analysis capability allowed them to discover this insight and redesign their onboarding to highlight the calendar feature, resulting in a 32% increase in trial-to-paid conversions.
Pros:
- Future-Proof Analysis: No need to predict which events might be important before tracking them.
- Deployment Simplicity: Minimal configuration required for comprehensive data collection.
- Business User Friendly: Non-technical teams can define and analyze events without developer support.
Cons:
- Data Volume: Autocapture approach generates large data volumes that can affect performance.
- Cost Scaling: Pricing increases significantly as session volumes grow.
- Analysis Complexity: The wealth of available data can be overwhelming without proper governance.
Countly
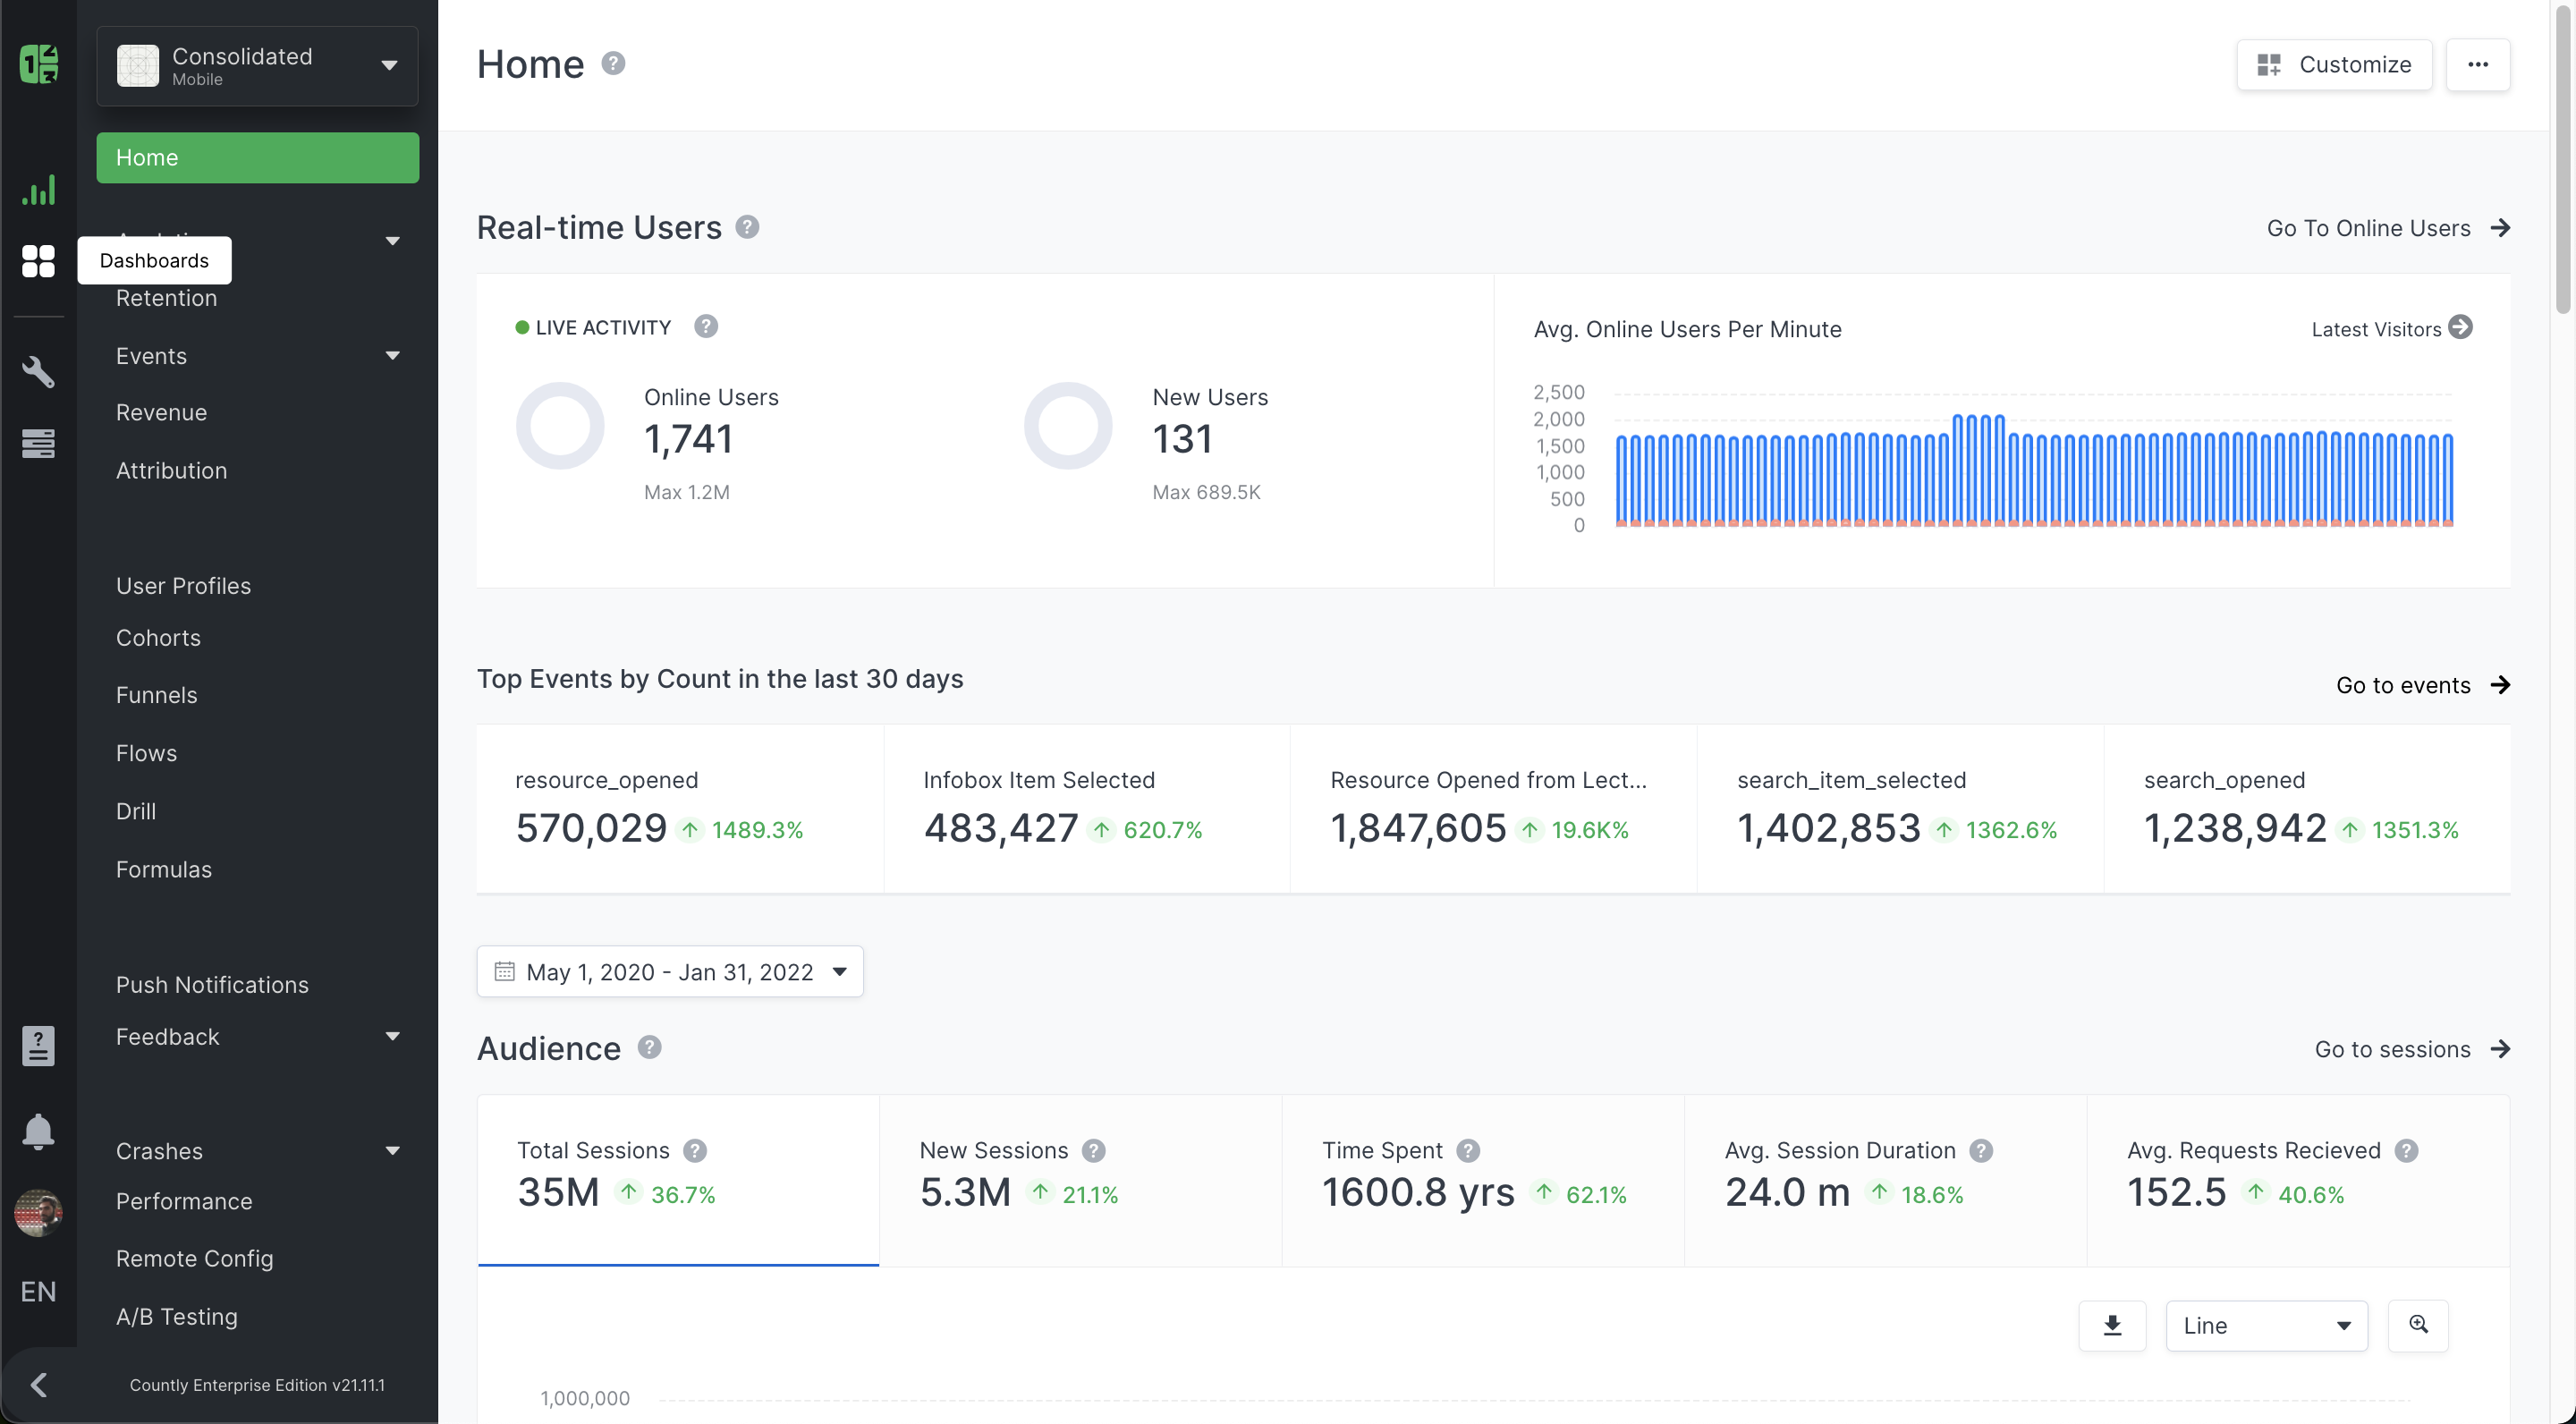
Countly stands out for its flexible deployment options, including self-hosting capabilities that give organizations complete control over their analytics data. This makes it particularly valuable for applications with stringent data sovereignty requirements or privacy concerns.
Key Features:
- Comprehensive Event Analytics: Track user actions and app performance metrics.
- Custom Dashboards: Build personalized views for different stakeholders and use cases.
- Crash Reporting: Identify and troubleshoot application crashes.
- Push Notifications: Send targeted messages based on user behavior and segments.
- A/B Testing: Test feature variations to optimize user experience.
Pricing:
- Community Edition: Free, open-source version with self-hosting capability.
- Enterprise Edition: Starting at $1,750/month with advanced features and support.
- Custom Plans: Tailored solutions for specific organizational requirements.
Implementation Case Study:
A healthcare app handling sensitive patient data deployed Countly’s self-hosted solution to maintain complete control over their analytics infrastructure. This allowed them to comply with strict HIPAA requirements while still gaining valuable insights into user behavior. They identified that users were abandoning medication tracking features due to a complex entry process, redesigned the flow, and saw a 56% increase in medication logging compliance—a critical metric for patient outcomes and app effectiveness.
Pros:
- Data Ownership: Self-hosting options provide complete control over analytics data.
- Privacy Focus: Designed with data protection regulations in mind.
- Extensibility: Plugin architecture allows for customization and extension.
Cons:
- Technical Requirements: Self-hosting requires infrastructure and maintenance expertise.
- Feature Complexity: More technical setup compared to some cloud-only solutions.
- Community Support: Smaller user community compared to some larger platforms.
Sensor Tower (With data.ai Integration)

Following its integration with data.ai (formerly App Annie), Sensor Tower has evolved into a comprehensive market intelligence platform that extends beyond your own app’s performance to provide competitive insights and market trend analysis.
Key Features:
- Competitive Intelligence: Track competitor performance, user acquisition strategies, and keyword positions.
- Market Trend Analysis: Identify emerging opportunities and shifts in user preferences.
- App Store Optimization: Optimize visibility with keyword tracking and metadata recommendations.
- Ad Intelligence: Monitor competitor advertising strategies across channels.
- Revenue Estimation: Access models that estimate competitor revenue and growth.
Pricing:
- Custom Pricing: Enterprise-focused pricing based on required features and data access.
Implementation Case Study:
A mid-sized mobile game developer used Sensor Tower to analyze their category landscape before launching a new title. They identified a specific game mechanic that was driving high engagement across successful competitors while also discovering an underserved sub-niche with limited competition. By incorporating the successful mechanic while positioning their marketing to target the gap in the market, they achieved 450,000 downloads in their first month—triple their previous launch performance—and secured a sustainable position in a crowded category.
Pros:
- Market Context: Provides broader industry insights beyond your own app performance.
- Competitive Advantage: Enables strategic decisions based on competitor analysis.
- Trend Identification: Helps spot emerging opportunities before they become mainstream.
Cons:
- Premium Pricing: Significant investment required for full feature access.
- Enterprise Focus: Less accessible for smaller independent developers.
- Estimation Limitations: Some metrics are modeled rather than directly measured.
Emerging Trends in Mobile App Analytics
AI-Powered Predictive Analytics
The latest generation of analytics platforms now incorporates advanced machine learning capabilities that go beyond reporting what happened to predicting what will happen. These systems can forecast user behavior, identify churn risk before it occurs, and recommend specific interventions to improve outcomes. For example, an entertainment app used AI predictions to identify users likely to cancel subscriptions and implemented personalized content recommendations, reducing predicted churn by 37%.
Privacy-Preserving Analytics
As privacy regulations tighten globally (GDPR, CCPA, CPRA, and others), analytics platforms are evolving to maintain effectiveness while respecting user privacy. New approaches include:
- Edge Computing: Processing data on-device before sending aggregated insights to servers
- Differential Privacy: Adding statistical noise to protect individual user identities while maintaining overall accuracy
- Consent Management: Sophisticated systems for tracking and honoring user privacy preferences
- Data Minimization: Collecting only essential information rather than all possible data points
Implementing these privacy-conscious approaches is increasingly becoming a competitive advantage, particularly in privacy-sensitive categories like health, finance, and children’s apps.
Behavioral Economics Integration
Advanced analytics platforms are now incorporating principles from behavioral economics to not just track actions but understand the psychological factors driving user decisions. These insights enable more effective experience design that aligns with natural human decision-making patterns. For instance, a productivity app analyzed completion patterns and discovered that breaking large tasks into sub-tasks with individual completion animations increased overall task completion by 41%.
Regulatory Compliance and Data Privacy Considerations
Implementing analytics solutions requires careful attention to evolving privacy regulations. Key considerations include:
GDPR Compliance (European Union)
The General Data Protection Regulation impacts any app with European users, regardless of where the company is based. Key requirements include:
- Obtaining explicit consent before collecting analytics data
- Providing mechanisms for users to access and delete their data
- Ensuring data minimization and purpose limitation
- Maintaining detailed records of processing activities
Non-compliance penalties can reach up to €20 million or 4% of global annual revenue, whichever is higher.
CCPA/CPRA Compliance (California)
California’s privacy regulations establish specific rights for California residents and impose obligations on businesses collecting their data. Requirements include:
- Providing notice at collection about data practices
- Honoring opt-out requests for data sales and sharing
- Responding to user requests to access, delete, or correct their data
- Implementing reasonable security measures
These regulations often serve as de facto national standards in the US market.
Children’s Privacy (COPPA)
Apps directed at children under 13 face additional restrictions under the Children’s Online Privacy Protection Act:
- Obtaining verifiable parental consent before collecting personal information
- Limiting data collection to what’s reasonably necessary
- Implementing special procedures for parental access and control
- Restricting behavioral advertising and profiling
Many analytics platforms offer specific configurations for COPPA compliance.
Selecting the Right Analytics Stack for Your Business Objectives
Rather than viewing analytics tools as an either/or decision, consider building a complementary stack that addresses different aspects of your measurement needs:
For Early-Stage Apps (Pre-Product Market Fit)
Focus on qualitative insights and fundamental metrics:
- Primary Tool: UXCam or similar session recording solution to understand user behavior patterns
- Supporting Tool: Basic event tracking with Google Firebase or AppMetrica
- Key Metrics: Retention (D1, D7), session duration, critical path completion rates
This combination provides deep insights into user experience while minimizing implementation complexity.
For Growth-Stage Apps (Scaling User Acquisition)
Expand to include attribution and marketing effectiveness measurement:
- Primary Tool: Branch.io or AppsFlyer for attribution and campaign measurement
- Supporting Tools: Mixpanel for product analytics and UXCam for qualitative insights
- Key Metrics: Customer acquisition cost (CAC), lifetime value (LTV), channel effectiveness, conversion funnels
This stack connects marketing efforts to product engagement for holistic growth optimization.
For Scaled Apps (Optimizing for Revenue and Retention)
Implement comprehensive analytics across the entire user lifecycle:
- Core Analytics: Amplitude or Mixpanel for deep behavioral analysis
- Market Intelligence: Sensor Tower or data.ai for competitive context
- Attribution: Branch.io or Singular for marketing measurement
- Qualitative Insights: UXCam for ongoing experience optimization
- Key Metrics: Revenue per user, retention cohorts, feature adoption, engagement depth
This comprehensive approach provides both detailed user insights and broader market context.
Implementation Best Practices
Successful analytics implementation goes beyond tool selection to include thoughtful strategy and execution:
Data Governance Framework
Establish clear naming conventions, event taxonomies, and documentation standards before implementation. This prevents the “data swamp” problem where collected data becomes unusable due to inconsistent tracking. Document:
- Event naming patterns and hierarchies
- Property/parameter standardization rules
- User property definitions and update protocols
- Data retention and access policies
Companies with structured data governance report 28% higher satisfaction with their analytics implementations.
Cross-Functional Analytics Team
The most effective analytics implementations involve collaboration between:
- Engineering: For technical implementation and data quality assurance
- Product: To define user journeys and critical events
- Marketing: To connect acquisition efforts with in-app behavior
- Data Science: For advanced analysis and insight generation
This cross-functional approach ensures that collected data serves diverse organizational needs.
Phased Implementation Strategy
Rather than attempting to track everything at once, implement analytics in strategic phases:
- Core Infrastructure: Basic user identification, session tracking, and critical events
- Conversion Funnels: Key journeys that drive business value
- Feature Usage: Detailed tracking of specific feature interactions
- Advanced Segmentation: Custom properties for sophisticated user grouping
This approach ensures you collect the most valuable data first while building toward comprehensive coverage.
Transforming Analytics into Action: The Insight-to-Impact Cycle
The true value of analytics comes not from data collection but from the actions it enables. Implement a structured process for converting insights into measurable improvements:
1. Insight Generation
Schedule regular analysis sessions (weekly for core metrics, monthly for deep dives) focused on specific questions:
- Where are users encountering friction in the conversion process?
- Which features correlate with higher retention and monetization?
- How do behavior patterns differ between high-value and average users?
- What acquisition sources deliver the highest-quality users?
Document insights along with supporting data and prioritize based on potential impact.
2. Hypothesis Formation
Transform insights into testable hypotheses:
- “If we simplify the checkout flow from 5 steps to 3, we will increase conversion by 15-20%”
- “Adding contextual feature tutorials will increase adoption of premium features by 25%”
- “Personalized re-engagement notifications based on past behavior will improve 30-day retention by 30%”
Clearly define the expected outcome and how it will be measured.
3. Experimentation and Implementation
Test hypotheses through controlled experiments:
- A/B tests for UI and experience changes
- Cohort comparisons for onboarding and messaging strategies
- Feature flags for progressive rollouts
Ensure proper instrumentation to measure the impact of each change.
4. Impact Assessment and Iteration
Measure results against predictions and document learnings:
- What worked as expected and why?
- What surprised us? What new insights emerged?
- How can we build on successful changes?
- What should we try next based on these results?
Organizations that implement this structured insight-to-action cycle report 3.2x higher ROI from their analytics investments compared to those using analytics primarily for reporting.
Conclusion: Analytics as a Competitive Advantage
In today’s hypercompetitive app marketplace, sophisticated analytics implementation has transformed from a nice-to-have feature into a fundamental competitive advantage. The most successful apps use analytics not just for measurement but as a strategic driver of continuous improvement across user experience, marketing efficiency, and monetization effectiveness.
The true power of mobile app analytics lies not in the tools themselves but in the organization’s ability to convert data into actionable insights and those insights into measurable improvements. By implementing the right combination of analytics solutions, establishing clear data governance practices, and creating structured processes for insight generation and experimentation, app publishers can create a virtuous cycle of data-driven optimization.
Whether you’re just beginning your analytics journey or looking to advance your current capabilities, focus on selecting tools that align with your specific business objectives and stage of growth. Remember that effective analytics is not about collecting the most data, but about asking the right questions and systematically using the answers to create exceptional user experiences that drive sustainable business results.
As privacy regulations continue to evolve and user expectations for personalized experiences grow simultaneously, the apps that will thrive will be those that master the balance between data-driven optimization and respect for user privacy. The analytics solutions profiled in this guide represent the current state of the art in achieving this balance—implementing them effectively will position your app for success in an increasingly competitive digital landscape.