Mobile Advertising Articles
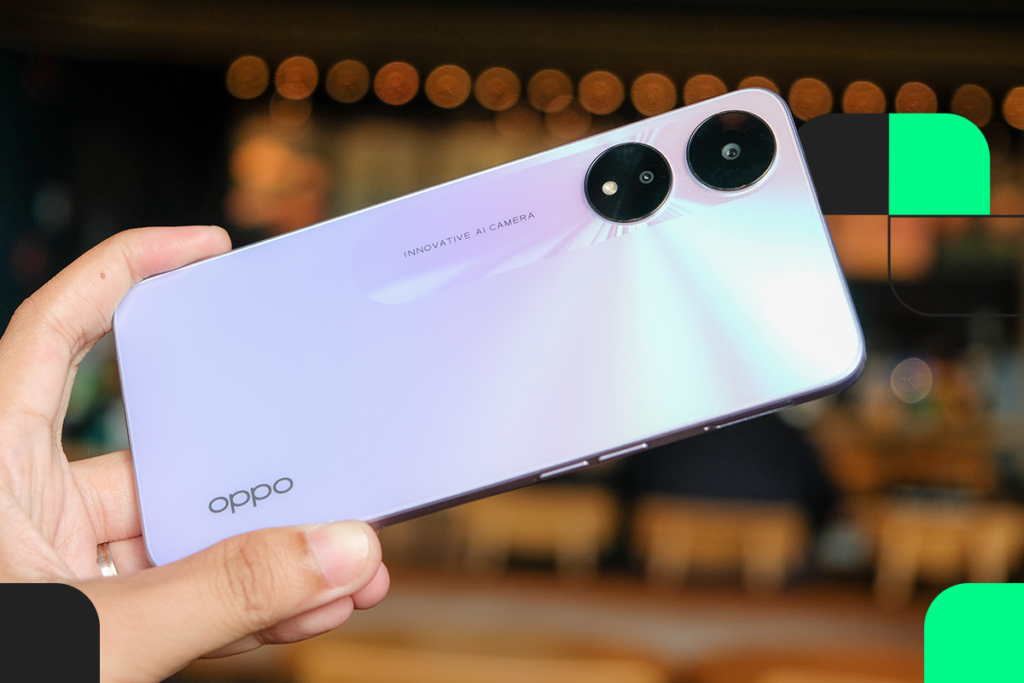
A Guide to Expanding Your App’s Reach with Oppo
4 MIN. READ In the world of app marketing, finding new growth channels is perpetual. As app developers and marketers seek new ways to reach their users, Oppo’s
4 MIN. READ In the world of app marketing, finding new growth channels is perpetual. As app developers and marketers seek new ways to reach their users, Oppo’s
2 MIN. READ We are excited to announce a strategic partnership between AppSamurai and Tenjin, which will lead to a new era of comprehensive growth solutions for mobile
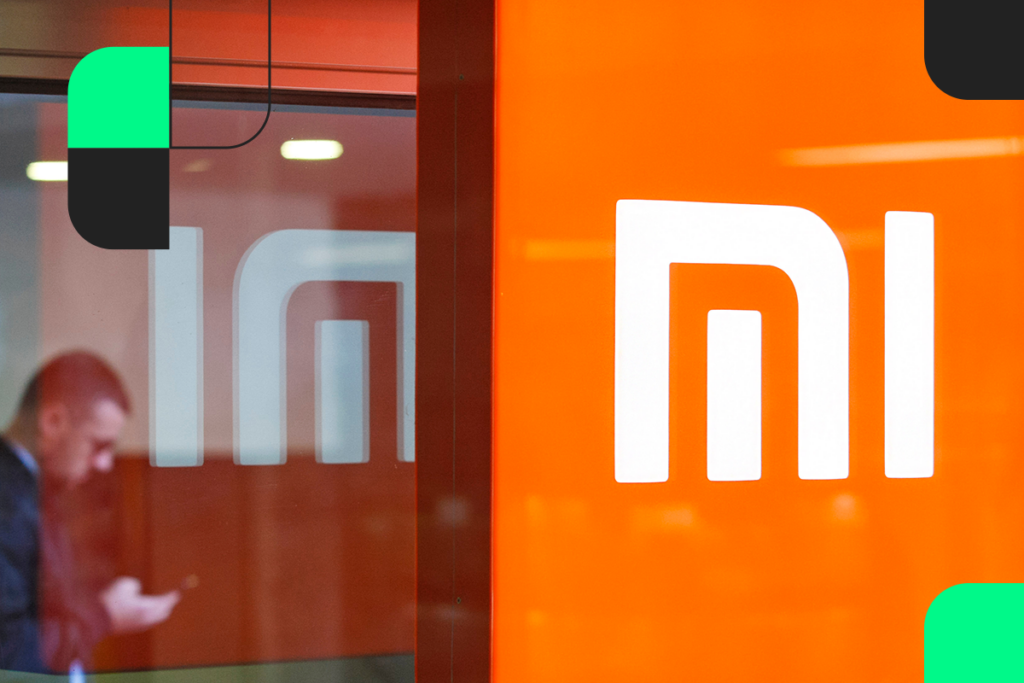
5 MIN. READ App marketers are constantly searching for alternative growth channels to maximize their reach. One avenue that holds significant promise is Xiaomi’s ecosystem, which is renowned

6 MIN. READ Have you ever found yourself clicking on a mobile game ad, expecting an exciting experience, only to realize that the game you downloaded doesn’t match

6 MIN. READ When it comes to mobile marketing, where every click and tap matters and understanding your users’ journey might be similar to solving a complex puzzle.

4 MIN. READ The Google Play and Apple App Store stand out as towering giants in the mobile world, commanding developers’ and consumers’ attention. However, alternative app stores

5 MIN. READ Valentine’s Day isn’t just about romance—it’s a golden opportunity for apps to shine. With February 14th just a few days away, it’s time to amplify

5 MIN. READ As more and more platforms and channels become available for user acquisition, determining the most effective strategy becomes increasingly critical. This is where Media Mix

3 MIN. READ OEMs (App Discovery) have gained popularity in recent years thanks to the native and premium placements offered to mobile marketers. In this blog post, we’ll

4 MIN. READ OEMs (App Discovery) are becoming more popular daily as the mobile marketing landscape constantly seeks out innovative ways to boost reach, engagement, and brand awareness.
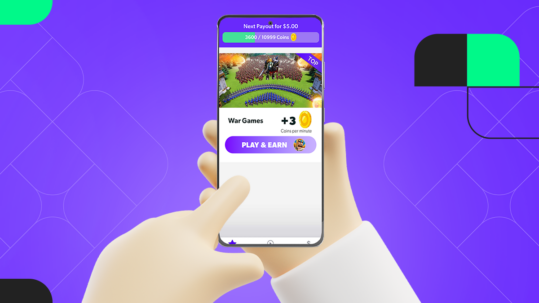
3 MIN. READ Developers in the dynamic field of mobile gaming are constantly looking for innovative strategies to captivate players and drive substantial revenue. AppSamurai’s Rewarded Playtime model,

8 MIN. READ Programmatic advertising has reshaped the digital advertising landscape by automating ad inventory buying and selling. As a result of this evolution from traditional ad-buying methods,